Fig. 2.
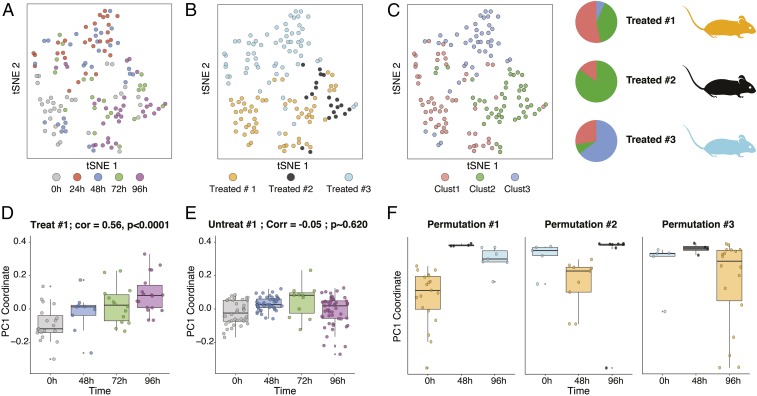
scRNA-Seq of captured CTCs demonstrates the utility of intramouse CTC profiling. The tSNE of all CTCs collected across three JQ1-treated mice is colored by time point posttreatment (A), mouse (B), and cluster of assignment based on k-nearest neighbors clustering (C). (Top Right) Pie charts show the fractional representation of each cluster in each treated mouse. Boxplots of the first PC of CTC transcriptomes from PCAs were obtained from longitudinally following the same treated mouse [D, correlation (Corr) = 0.56] or untreated mouse (E, Corr = −0.05). Each point represents a CTC. (F) Boxplots of the first PC from three different “mock terminal bleed” permutations across three treated mice (SI Appendix, Supplementary Information Text and Fig. S9).

