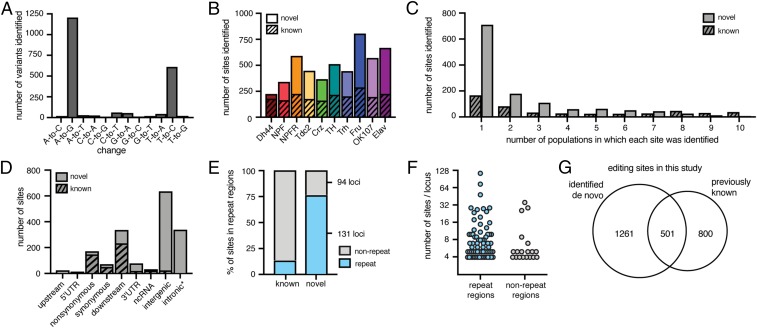
Fig. 2.
Identification of RNA editing sites from distinct neuronal populations. (A) The total number of all variants identified de novo. (B) The number of editing sites identified de novo from each population, split into known sites in stripes and novel sites in solids. (C) Histogram of the number populations in which each known site and novel site was identified de novo. (D) The number of known and novel sites found in each annotated location. *353 sites annotated as intronic are found in the Myo81F heterochromatic region of chr3R. (E) The percentage of known and novel sites identified by our pipeline that overlap annotated repeat regions (blue) or do not (gray). (F) The number of novel editing sites found within each locus that contained at least four sites, for loci overlapping repeat regions and nonrepeat regions. y axis is log2 scale. (G) Venn diagram of editing sites identified de novo and known editing sites used in this study.

