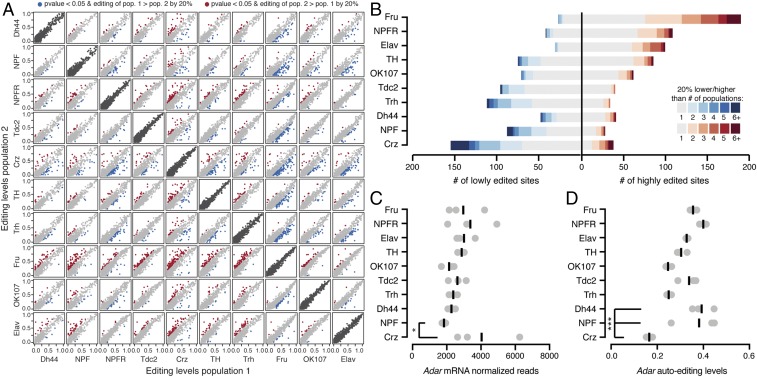
Fig. 3.
RNA editing level differences between neuronal populations. (A) Pairwise comparisons of editing levels from three combined replicates of mmPCR-seq or RNA-seq between 10 populations. Red and blue dots are editing sites that differ by >20% editing between populations with P < 0.05 (Fisher’s exact tests), and gray dots are sites with <20% editing change. Dark gray dots are representative biological replicates of each population. (B) The number of editing sites that are more highly or lowly edited in each population listed on the left compared with all other populations. Shades of blue and red represent the number of populations in which each site differs in pairwise comparisons. (C) Adar mRNA normalized read counts from RNA-seq of each population. Each dot is one replicate with bars representing the mean. *P < 0.05 (Wald test). (D) Editing levels at the Adar auto-editing site at chrX:1781840 in all populations. Each dot is one replicate, with bars representing the mean. ***P < 0.001 (Fisher’s exact test) and editing change >20%.

