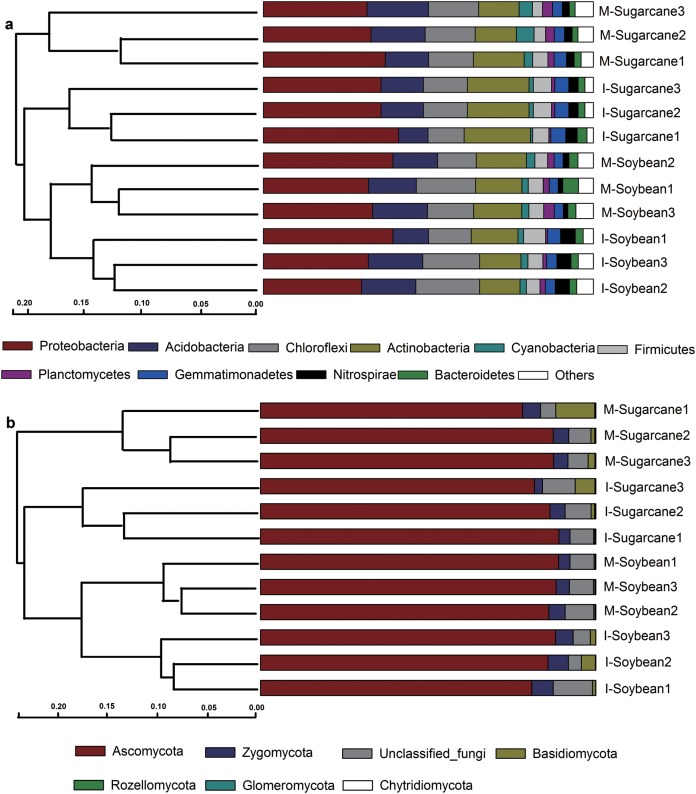
Figure 3. Relative abundance of bacterial and fungal phyla.
Phylogenetic relationships of bacterial (A) and fungal (B) communities shown with the relative abundances of different phyla. M-Sugarcane, sugarcane monoculture; I-Sugarcane, intercropped sugarcane. M-Soybean, soybean monoculture; I-Soybean, intercropped soybean.

