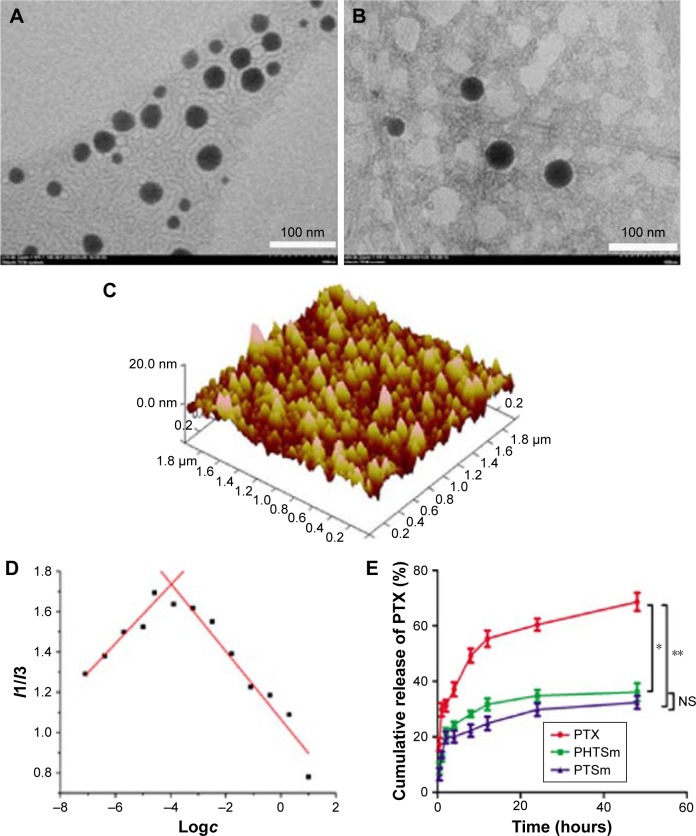
Figure 2.
Characterization of micelles. TEM photo of PTSm (A) and PHTSm (B), and the AFM photo of PHTSm (C). The fluorescence intensity ratio of I1/I3 from pyrene emission spectra vs the log of the concentration (D). The in vitro PTX release profile (E). *P<0.05, **P<0.01.
Abbreviations: AFM, atomic force microscopy; NS, nonsignificant; PTX, paclitaxel; TEM, transmission electron microscopy.

