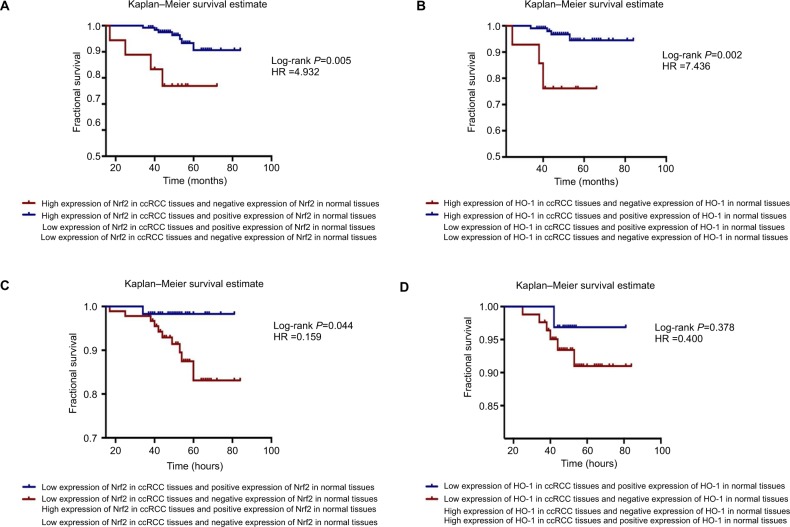
Figure 5.
Simultaneous analysis of the protein expression levels in carcinoma and adjacent normal tissues.
Notes: The Kaplan–Meier survival estimate was performed to determine the MST and OS rate. (A) The group highly expressing Nrf2 in cancer tissues but not in paracancerous tissues had the worst prognosis of all the subgroups (log-rank P=0.005, HR =4.932). (B) There was a group with high expression levels of HO-1 in cancer tissues but not in paracancerous tissues had the worst prognosis (log-rank P=0.002, HR =7.436). (C) Patients with low levels of expression of Nrf2 in ccRCC but positive expression of Nrf2 in paracancerous tissues had better prognoses (log-rank P=0.044, HR =0.159). (D) The HO-1 protein was expressed at low levels in ccRCC and at higher levels in paracancerous tissues, and the patient’s prognosis was better (log-rank P=0.378, HR =0.400).
Abbreviations: ccRCC, clear cell renal cell carcinoma; MST, mean survival time; OS, overall survival.

