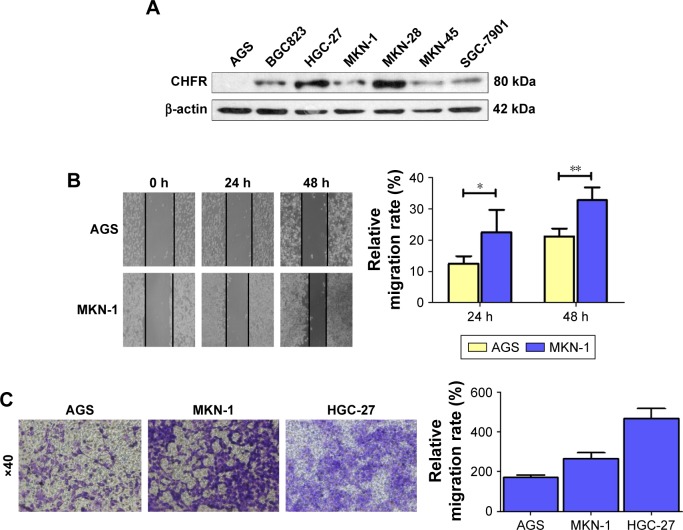
Figure 2.
Relevance between CHFR expression levels and migration ability of gastric cancer cell.
Notes: (A) CHFR levels expressed in human gastric cancer cell lines using Western blotting. β-actin was used as a loading control. (B) Migration ability of gastric cancer cell lines AGS and MKN-1 at indicated time tested by wound healing assay (left panel). Quantitative analysis of the gap of wound healing assay was performed (right panel). The data are presented as the mean ± SD of three independent experiments. *P<0.05 vs control group at 24 hours, **P<0.01 vs control group at 48 hours. (C) The basal migration activity of AGS, MKN-1, and HGC-27 cells was determined using a transwell assay for 24 hours (left panel). Quantitative analysis of gastric cell migration in transwell assay was also performed (right panel). The data are presented as the mean ± SD of three independent experiments.

