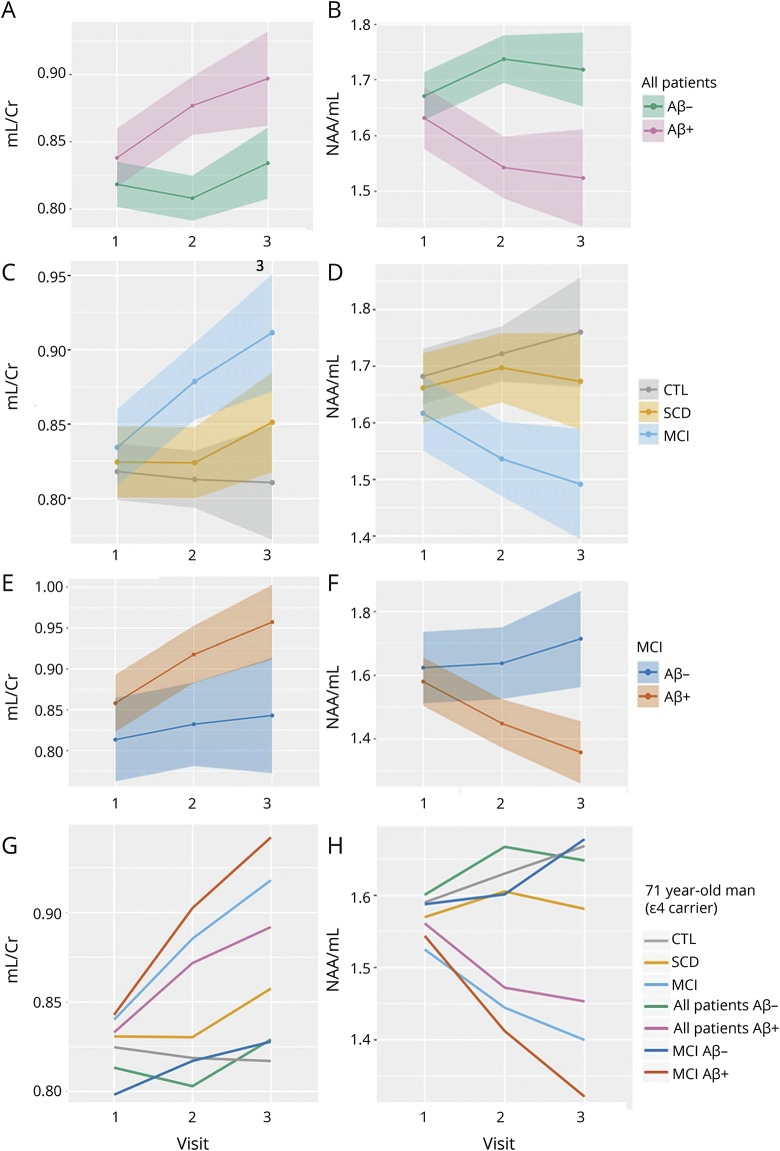
Figure 2. Estimated rates of change in mI measures across different biomarker and diagnostic groups.
Estimated rates of change in mI/Cr and NAA/mI in different biomarker and diagnostic groups. Model 1 was created using data from the entire cohort to assess whether baseline Aβ status affects the rate of change in (A) mI/Cr and (B) NAA/mI. Model 2 was built using data from the entire cohort, in order to examine whether baseline diagnosis affects the rate of change in (C) mI/Cr and (D) NAA/mI. Model 3 only used data from the MCI group as input, examining the rate of change in (E) mI/Cr and (F) NAA/mI. Based on these models, we present estimated trajectories of change over time in (G) mI/Cr and (H) NAA/mI for a 71-year-old man, who is an APOE ε4 carrier. Aβ = β-amyloid; Cr = creatine; CTL = cognitively normal control; MCI = mild cognitive impairment; mI = myo-inositol; NAA = N-acetylaspartate; SCD = subjective cognitive decline.

