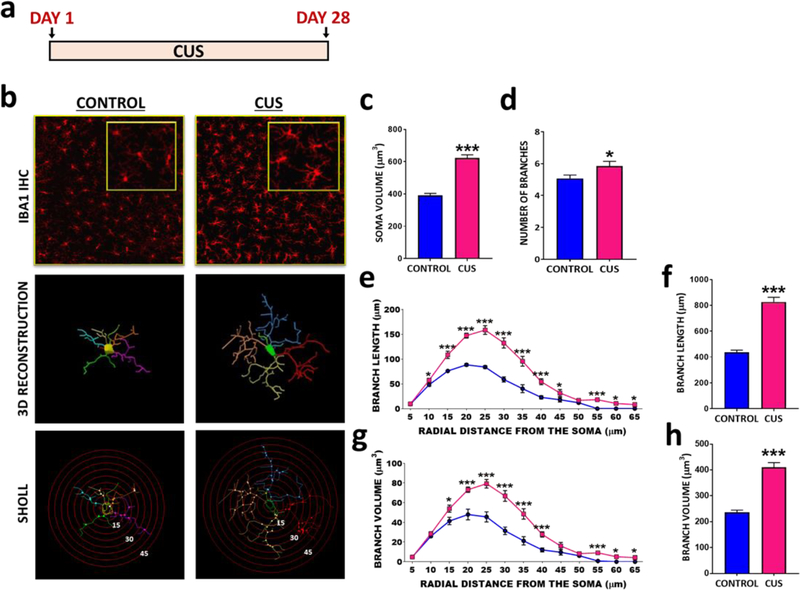
Figure 1. CUS alters microglial morphology in dorsal hippocampus of rats.
(A) CUS paradigm. (B) Immunohistochemical detection of microglia marker IBA1 within the CA3 pyramidal cell layer, followed by 3D reconstruction and Sholl analysis in Control and CUS rats. Average (C) soma size (t(466)=9.90, p<0.0001), (D) branch number (t(97)=2.18, p=0.0314), (E) total branch volume (t(97)=9.49, p<0.0001) and (G) total branch length (t(97)=10.89, p<0.0001). Sholl analysis for (F) branch length and (H) branch volume in control and CUS animals as a function of distance from soma. The results are expressed as the mean ± SEM., N=4 animals per group, > 60 cells per group. *p<0.05 and ***p<0.001. Student t-test performed for average soma size, branch number and total branch length and volume. Student t-test performed for each distal point of Sholl analysis and significance was determined based on adjusted p values.

