. 2018 Mar 28;8(22):12017–12028. doi: 10.1039/c7ra12799e

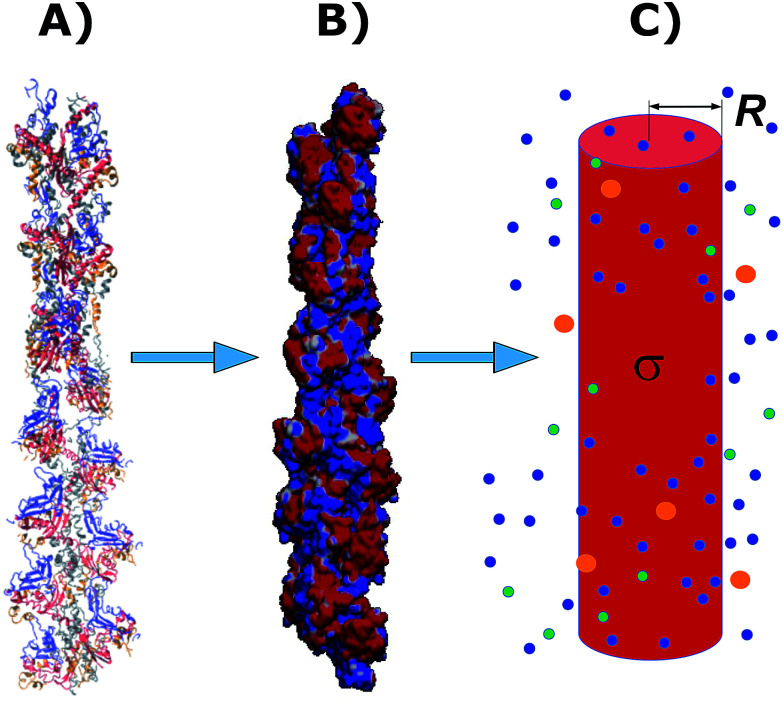
Fig. 2. A Cong model representation of F-actin used to visualize the polymerized protein from three different viewpoints when immersed in a saline solution of sodium chloride at pH 7.2. (A) A ribbon diagram of 13 monomers polymerized into a single actin filament illustrating the effects of the electrolyte on the residues exposed to the surface. (B) A filament volume representation of F-actin showing potential on the surface of the actin filament (C) a cylindrical characterization of F-actin with radius R and surface charge density σ, used to calculate the components of the electric circuit model (see Fig. 3), with surrounding ions.

Fig. 2