An official website of the United States government
Here's how you know
Official websites use .gov
A
.gov website belongs to an official
government organization in the United States.
Secure .gov websites use HTTPS
A lock (
) or https:// means you've safely
connected to the .gov website. Share sensitive
information only on official, secure websites.
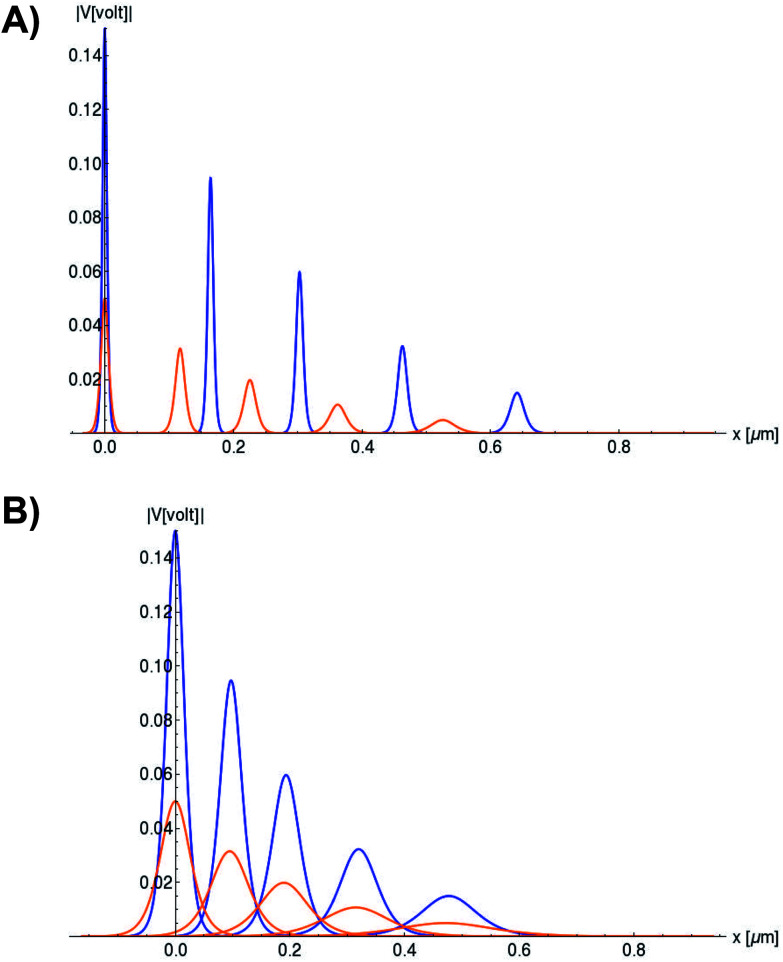
 . Orange and blue colors represent the electrical signal impulse generated by 0.05 V and 0.15 V input voltage peaks, respectively. (a) Soliton profile along F-actin in intracellular conditions. The first, second, third, fourth and fiftieth peaks (same color) appearing from left to right correspond to the following snapshots t = 0s,t = 6s, t = 12s, t = 30s, and t = 60s, respectively. (b) Soliton profile along F-actin in in vitro conditions. The first,second, third, fourth and fiftieth peaks (same color) appearing from left to right correspond to the following snapshots t = 0s,t = 2:8s, t = 5:7s, t = 14:3s, and t = 28:6s, respectively.