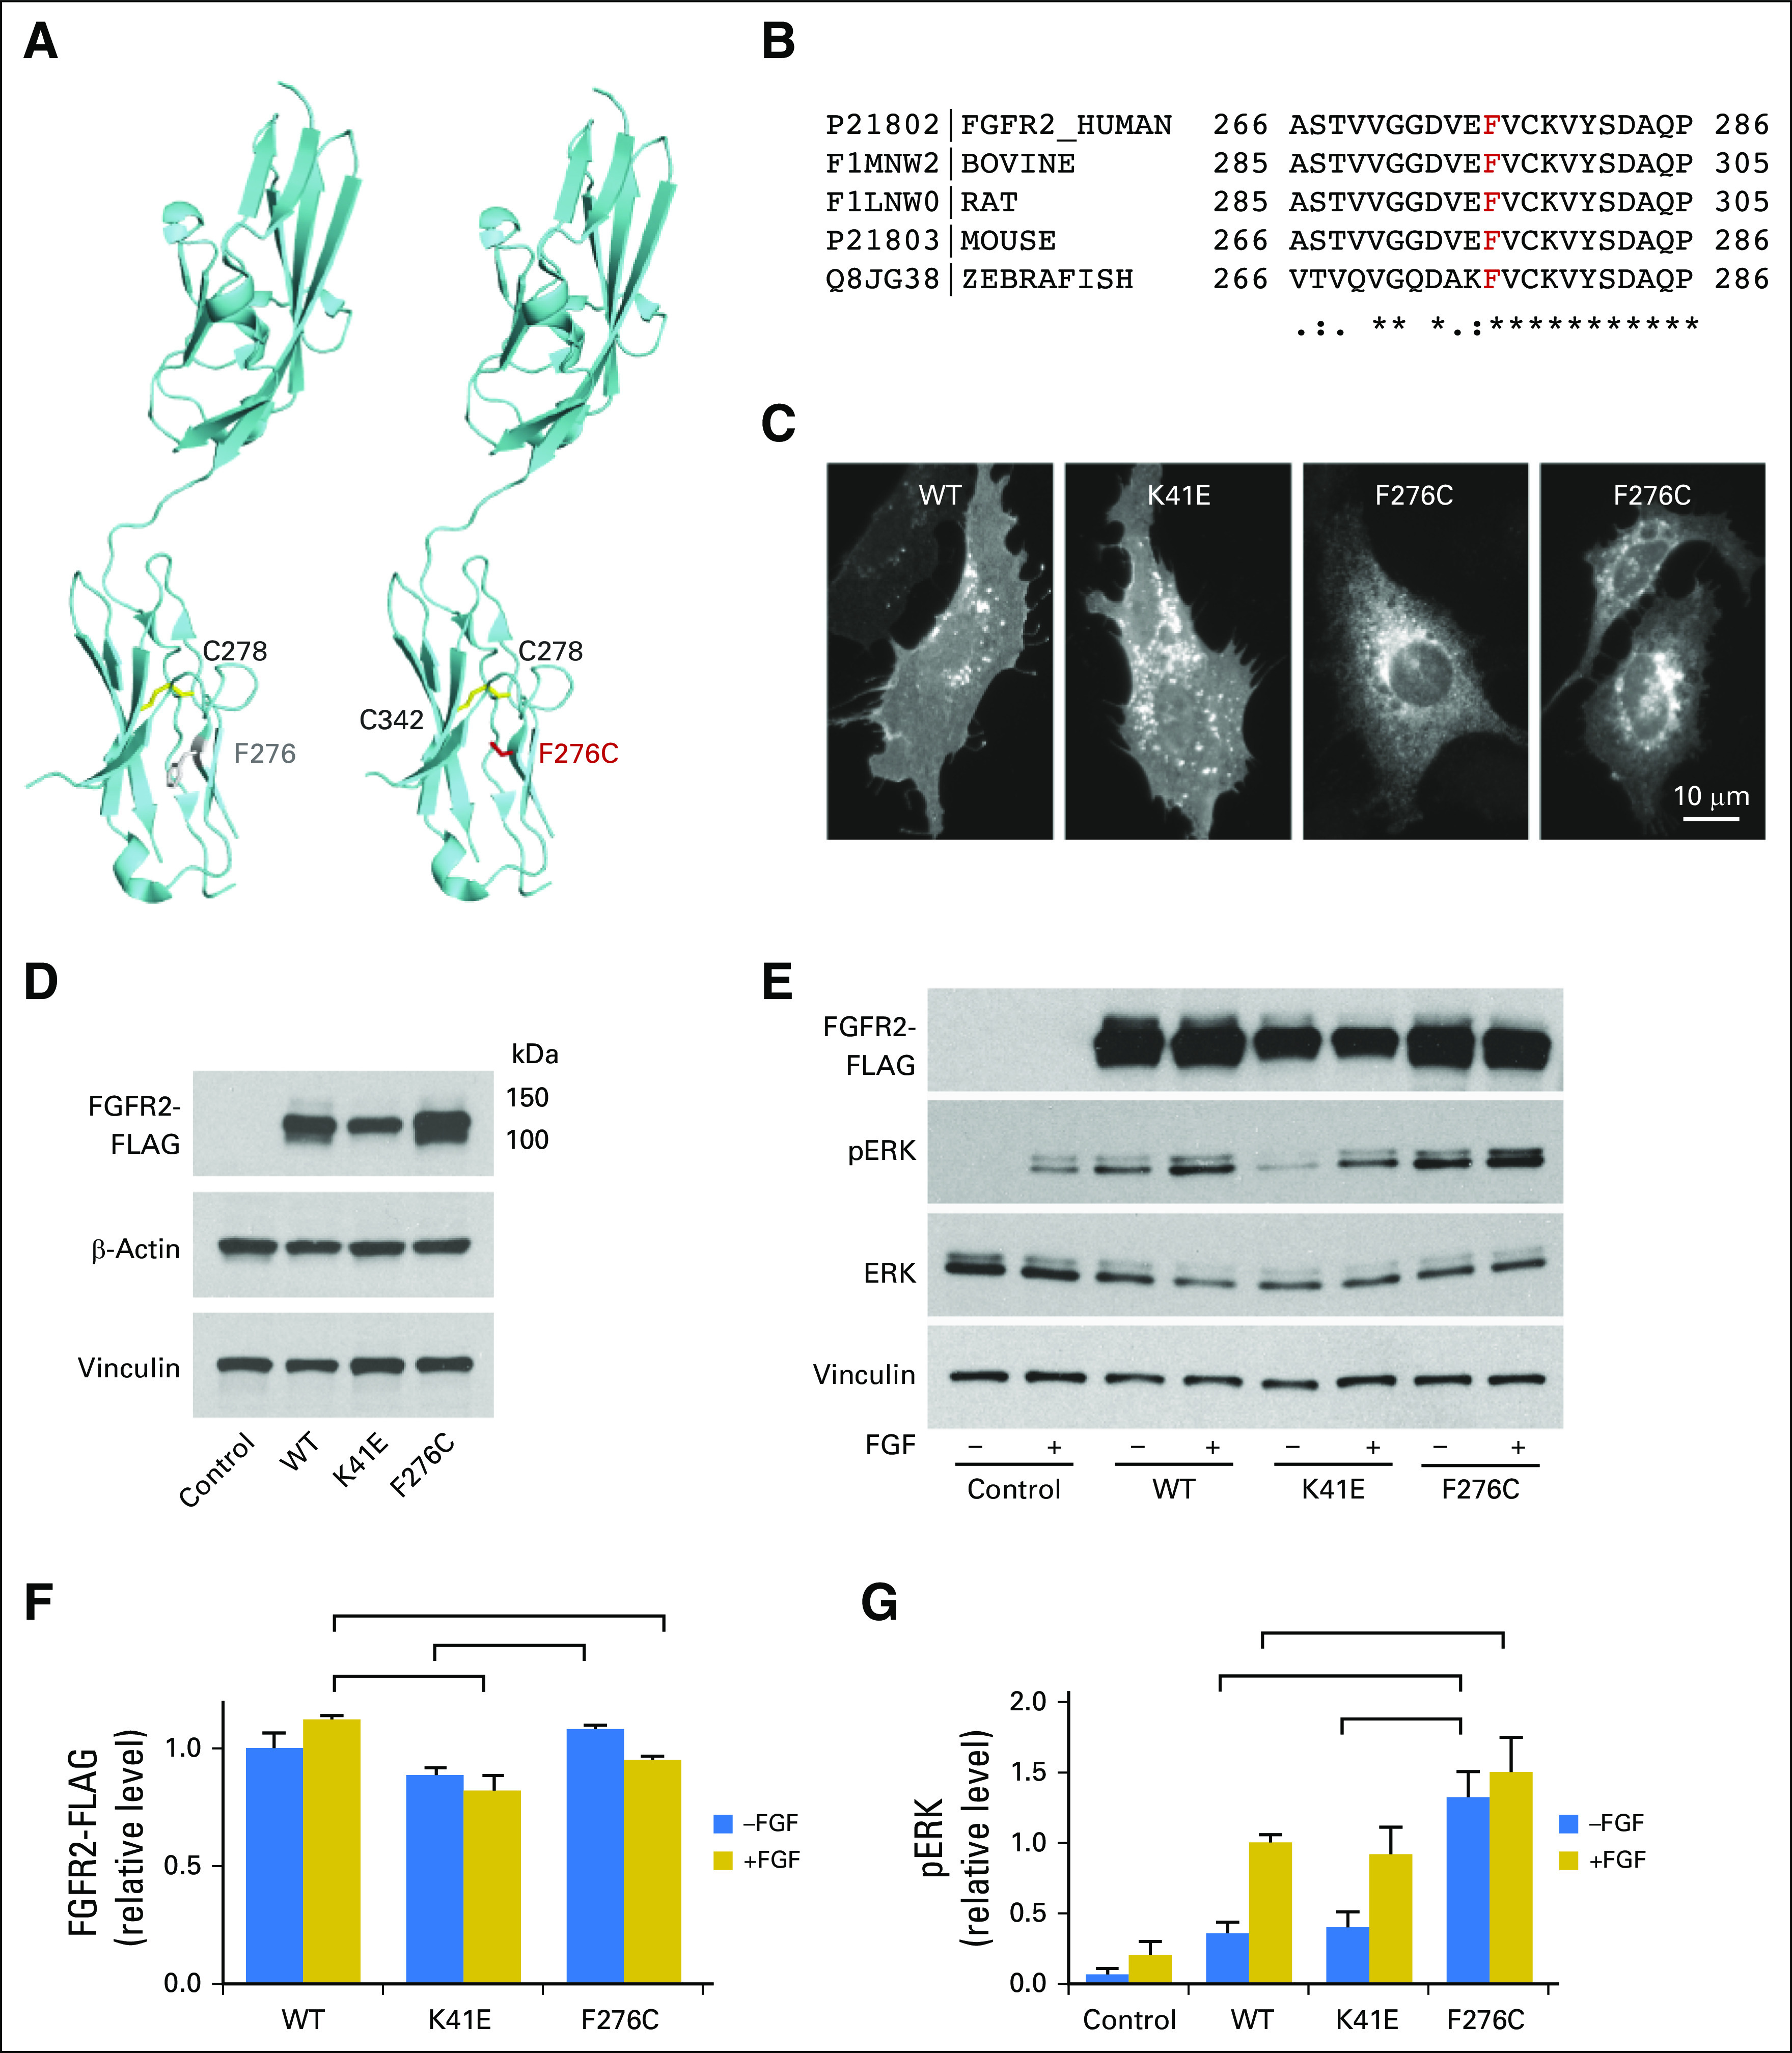
Fig 4.

Altered expression and signaling of FGFR2 variants. (A) PyMOL modeling of wild-type (WT; left) and F276C (right) FGFR2 proteins. The extracellular receptor of FGFR2 contains an intrinsic disulfide bond between C278 and C342 in the immunoglobulin-like domain 3 (Ig3; shown in gold). Residue F276 is highlighted in gray and is proximal to the disulfide bridge. The FGFR2 F276C variant (highlighted in red) may lead to the introduction of aberrant disulfide bonds that could alter the activation state of the protein. (B) Sequence alignment shows that residue F276 is highly conserved among the FGFR2 family from zebrafish to humans (sequence alignment performed by using Clustal Omega [EMBL-EBI, Wellcome Genome Campus, UK]; UniProtKB entry numbers are shown). (C) HuCCT-1 cholangiocarcinoma cells transfected with the WT, K41E, and F276C FGFR2 forms for 2 days were fixed, permeabilized, and processed for immunofluorescence by using the FLAG antibody. Images show typical cellular localization of the WT, K41E, and F276C FGFR2 proteins. (D) KMCH-1 cells were transfected with FGFR2 forms by using equal amounts of DNA. After 1 day, cells were switched to serum-free medium and incubated for an additional 16 hours before lysis. Lysates were analyzed for expression of FGFR2 by using an antibody against the FLAG-tag. Housekeeping proteins (β-actin and vinculin) were also detected. Equal total protein (5 μg) was loaded per lane. (E) Functional testing of FGFR2 signaling. KMCH-1 cells were transfected with FGFR2 forms by using a 3.5/5 ratio of F276C/WT and K41E DNA to adjust expression of the F276C protein to similar levels as the WT form. After 1 day, cells were switched to serum-free medium with or without 20 ng/mL FGF2 and incubated an additional 16 hours at 37°C before lysis. Lysates were analyzed by Western blot for expression of FGFR2-FLAG, phospho-ERK (pERK), total ERK, and vinculin. (F) Quantitation of FGFR2 levels in Western blots as in (E). Values are mean ± SE from three experiments normalized to WT (−FGF2) levels. (G) Quantitation of pERK levels in Western blots as in (E). Values are mean ± SE from three experiments normalized to WT (+FGF2) levels. Brackets indicate groups within treatment types (−FGF or +FGF) among FGFR2-expressing samples that were significantly different (P < .05) from one another in two-tailed t tests. In (G), pERK levels from all FGFR2-transfected groups were significantly different from each control group.
