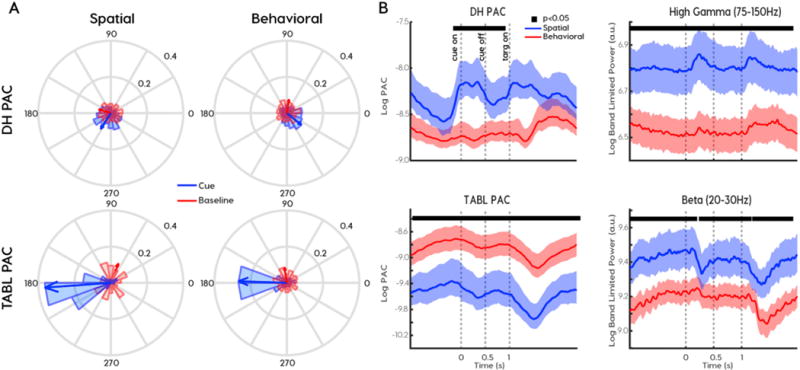
Fig. 4.

Phase preferences and relative PAC magnitude distinguish coupling frequencies and functional classes. (A) Preferred phases differed for delta to high-gamma (DH) PAC (top row) and theta-alpha to beta-low-gamma TABL PAC (bottom row) across spatial (left column) and behavioral (right column) cortical sites. Coupling emerged in the cue period (blue) relative to baseline pseudo-trials (red). Arrows indicate the circular mean of preferred phases across all subjects and cortical sites. (B) The relationship between PAC magnitude (left column) and the corresponding frequency-for-amplitude power (right column) reverses across behavioral (red) and spatial (blue) cortical sites. Solid black lines at top of graph indicates clusters of samples where spatial and behavioral signals were significantly different at p < 0.05.
