Figure 1.

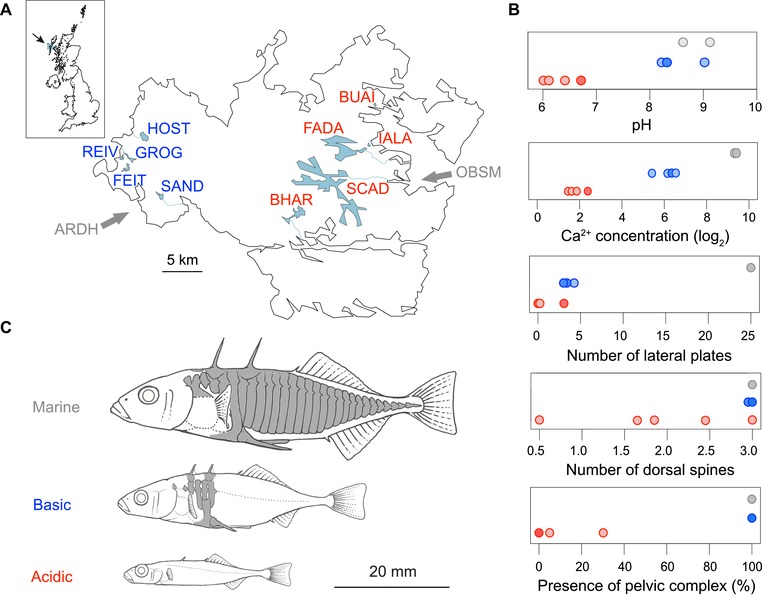
Stickleback study populations and their habitats. (A) Geographic situation of the basic (blue) and acidic (red) lakes on North Uist, Outer Hebrides, Scotland, with their connections to the sea shown as fine blue lines (the outlet of FEIT is uncertain). The gray arrows indicate the two coastal lagoons where marine stickleback were sampled. The same habitat‐specific color coding is used throughout the paper. (B) pH, calcium (Ca2+) concentration (in mg/L), and armor trait (lateral plate and dorsal spine counts, presence of pelvic spines and pelvic complex) mean values across individuals for each study site (data presented in detail in Supporting Information Table S1). The data points are arranged vertically according to habitat type, and they sometimes overlap (especially in the phenotypically uniform marine fish; overlap is indicated by darker dots). Data on pH and calcium concentration are from Magalhaes et al. (2016). Calcium measurements were log2 transformed. (C) Typical stickleback ecotypes from the three focal habitats, drawn to relative scale. Elements of bony armor are shaded in gray, including the dorsal spines, lateral plates, and the ventral pelvic complex to which the pelvic spines attach.
