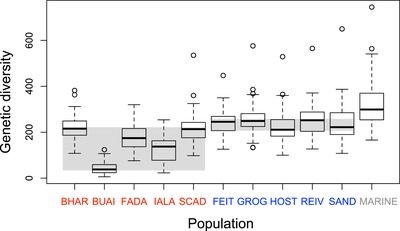
Figure 7.

Genetic diversity within populations, expressed as the number of SNPs passing a MAF threshold of 0.3 across 1 Mb windows centered at the 42 random SNPs, visualized by standard boxplots (i.e., thick lines represent the medians, rectangular boxes the interquartile ranges, IQR). The populations are ordered by habitat (acidic, basic, and marine). The gray background rectangles indicate the range of the medians across all five populations within the basic and within the acidic ecotypes. The marine population reflects the combination of the OBSM and ARDH samples; considering the larger of the two (OBSM, N = 20) alone, however, leads to very similar results (OBSM only: median diversity = 294, IQR = 251–356; OBSM and ARDH combined: median = 299, IQR = 254–370).
