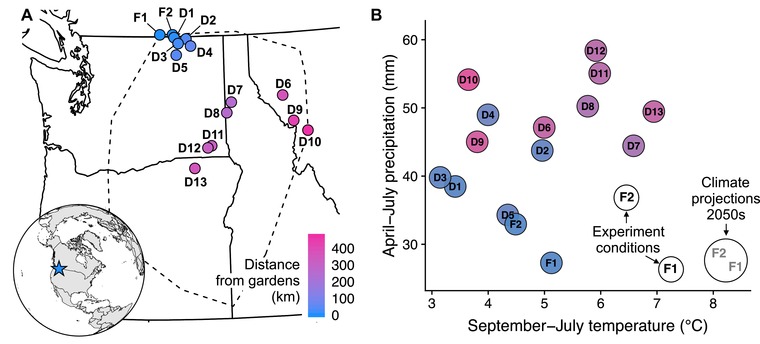
Figure 1.

Geographic locations and climate averages of populations used in this experiment. (A) Populations span the northern half of the geographic range of Clarkia pulchella (indicated by the dashed line; the range is represented by the extent of localities in the Consortium of Pacific Northwest Herbaria database). Focal population sites (where common gardens were installed) are indicated by “F” and donor population sites are indicated by “D”. Identifying codes for each population correspond to the Map ID column in Table S1. (B) Temperature and precipitation conditions of common gardens and source provenances (calculated from monthly PRISM data; PRISM Climate Group 2017). Colored circles represent the 1951‐1980 average September‐July temperature and summed April‐July precipitation in the home site of each population. Open circles represent weather conditions during the experiment. Focal populations are historically intermediate relative to donor populations in average historic temperature (x‐axis), but are from the driest sites of any population used in the experiment (y‐axis). Conditions in common gardens during the experiment were hot relative to normal conditions at those sites, and hot and dry relative to average conditions of all populations in the experiment. Conditions during the experiment were not quite as warm as projected temperatures for 2055 under the HadGEM2‐ES RCP 4.5 model (grey text; downscaled using ClimateNA, Wang et al. 2016).
