Figure 3.

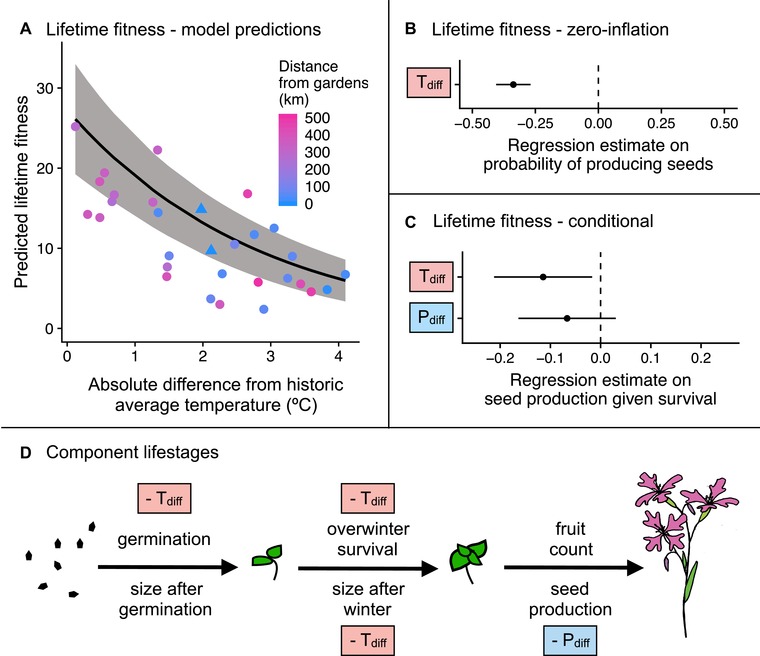
Effects of absolute temperature difference (September–July; Tdiff) and absolute precipitation difference (April–July; Pdiff) on performance of Clarkia pulchella in common gardens. These analyses include within‐population plants only (no gene flow). (A) Lifetime fitness (number of seeds produced by each seed that was planted) declines with increasing differences in temperature between the historic average of the source population and the experimental conditions in the transplant gardens. The regression line and 95% confidence interval incorporate both the conditional and zero‐inflation model components; the confidence interval is conditioned on fixed effects only. Though these temperature differences are expressed as absolute, almost all populations were from sources that are historically cooler than the transplant sites were during the experiment. Points are raw averages for each source population in each garden, colored by the distance between the source population and the transplant garden. Triangles are focal populations in their home sites. (B) Regression estimates and standard errors from the zero‐inflation part of a model of lifetime fitness. (C) Regression estimates and standard errors from the conditional part of a model of lifetime fitness. (D) Schematic of effects of absolute temperature differences (Tdiff) and absolute precipitation difference (Pdiff) on component lifestages of Clarkia pulchella. Directionality of effects is illustrated with “‐”; in these analyses all significant effects were negative. Predictors in boxes are significant (P < 0.05). Size in the previous lifestage is not shown here, but has a significant positive effect on overwinter and reproductive lifestages. This summarizes the significant results of separate models for each lifestage; full statistical results of these tests are in Table S3.
