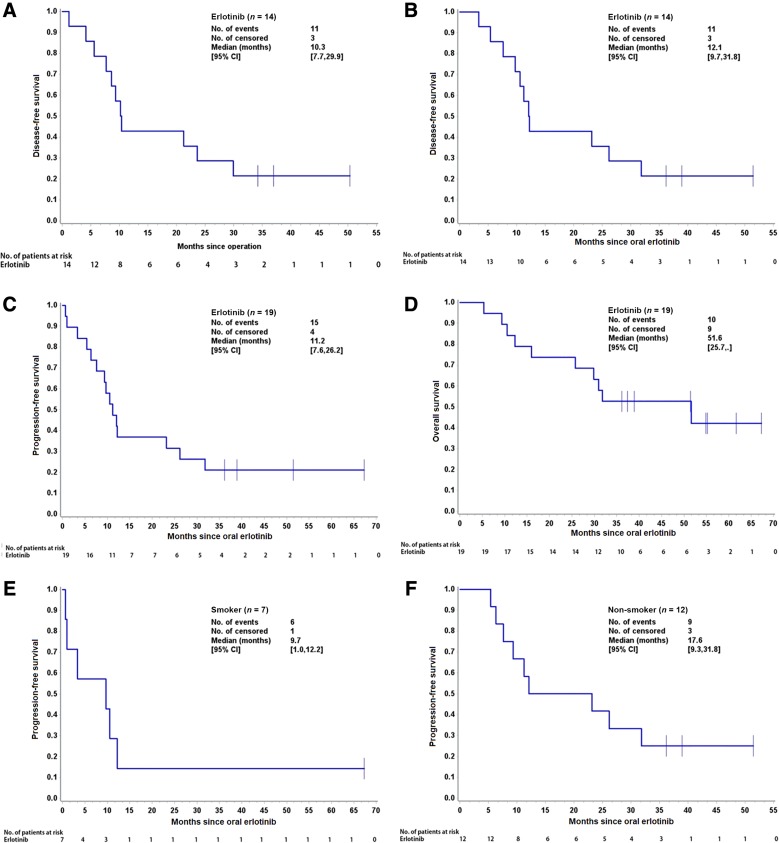
Figure 3.
Kaplan‐Meier curves of disease‐free survival (DFS), progression‐free survival (PFS), and overall survival (OS). (A): DFS for 14 patients who underwent surgery (calculated from the date of oral EGFR tyrosine kinase inhibitor to the first date of disease progression). (B): The DFS time of 14 patients who had surgery (calculated from the date of operation to the first date of disease progression). (C): PFS for all 19 patients. (D): OS for all 19 patients. (E): PFS for patients who were smokers. (F): PFS for patients who were nonsmokers.
Abbreviation: CI, confidence interval.

