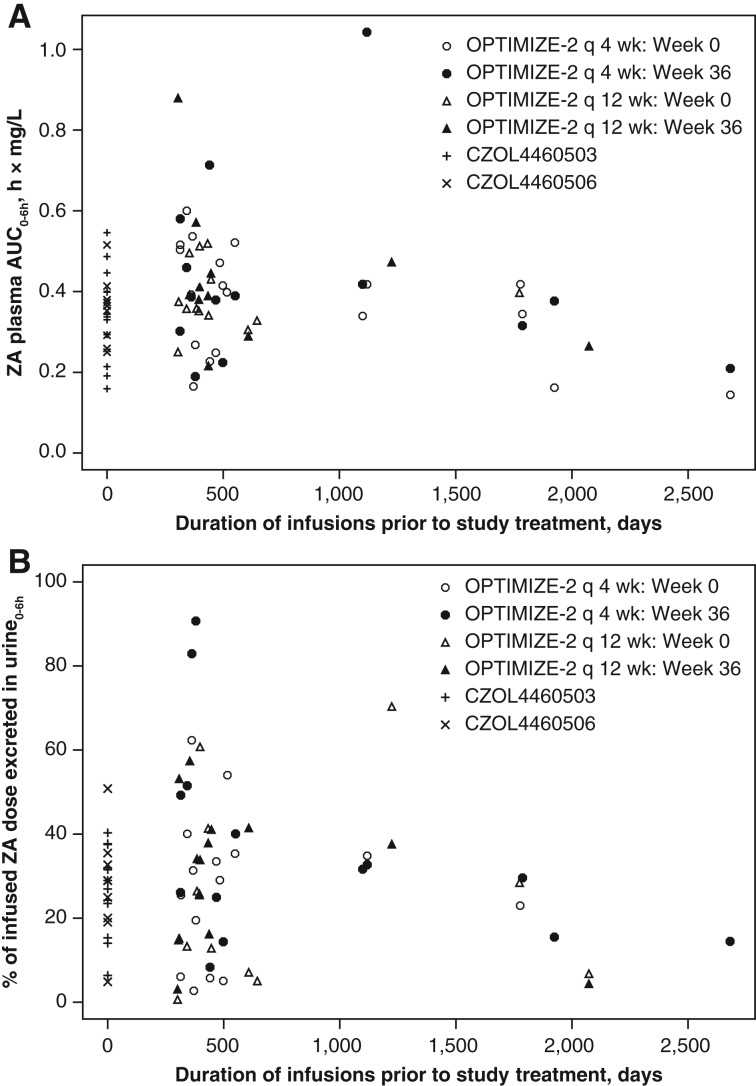
Figure 2.
ZA levels in plasma and urine versus number of years that the patient received standard once‐monthly ZA dosing. (A) ZA plasma AUC0–6h versus number of years that the patient received standard once‐monthly ZA dosing. (B) Percentage of infused ZA dose excreted in urine versus the number of years that the patient received standard once‐monthly ZA dosing. Abbreviations: AUC, area under the curve; q, every; ZA, zoledronic acid.

