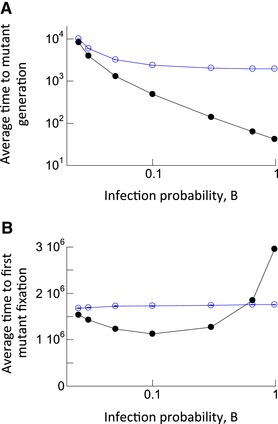
Figure 2.

(A) Average time to generation of first mutant in the agent‐based model with mutations. Black closed circles denote the simulation results in the presence of multiple infection, and blue open circles denote simulation results in the absence of multiple infection. Standard errors are shown, but are relatively small and hard to see. The number of simulation runs for increasing values of B for black circles are: 166,137; 403,110; 906,346; 8,000,789; 8,992,529; 15,656,759; and 19,553,451. For blue circles: 2,159,214; 4,376,870; 5,980,191; 10,651,321; 11,229,080; 10,103,400; and 22,652,139. (B) Average time until the number of mutant‐infected cells reached 90% of the whole infected cell population in the model with mutation and back‐mutation (neutral mutants). The black closed circles show simulation results in the presence of multiple infection, the blue open circles show results without multiple infection. The simulation was started with the wild‐type virus population at equilibrium. Parameters were chosen as follows: B = 0.025, A = 0.02, L = 1, D = 0.01, μ = 3 × 10⁻⁵, N = 900. Standard errors are shown, which, however, are very small and hard to see. For increasing values of B, the number of simulations for the black circles was: 27,629; 34,858; 29,688; 42,050; 30,574; 39,744; and 20,570. For blue circles: 34,419; 39,953; 29,128; 38,395; 34,234; 72,679; and 64,963. Trends of how multiple infection affects the plotted measures are statistically significant according to the two‐sample t‐test (very low P‐values, not shown).
