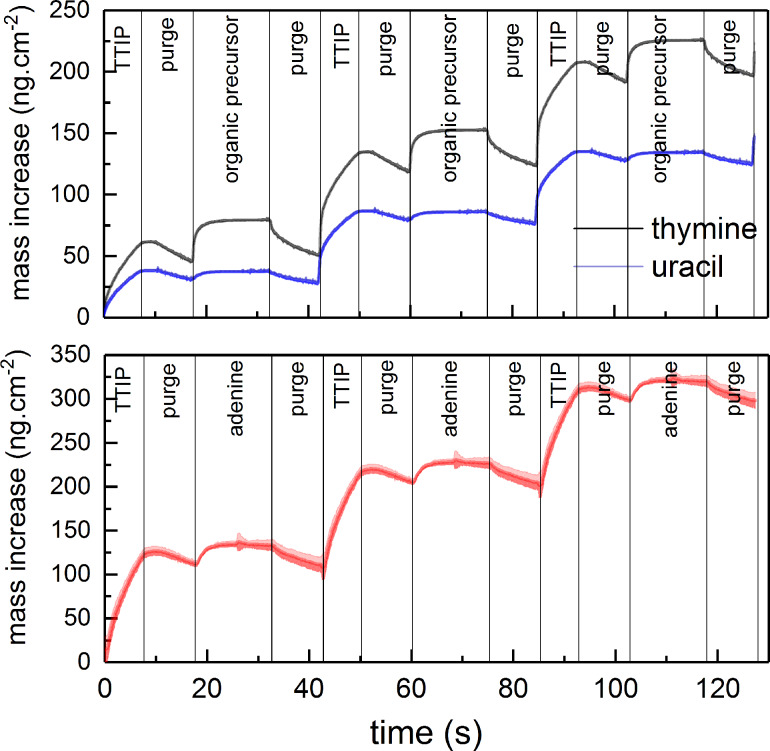
Figure 3.
Evaluation of mass increase during growth by QCM using TTIP and thymine (at 225 °C), uracil (at 225 °C) (top graph), or adenine (250 °C) (bottom graph). The shaded area represents the standard deviation during 16 cycles, where the noise in the middle of the adenine pulse stems from edge effects of the statistics.

