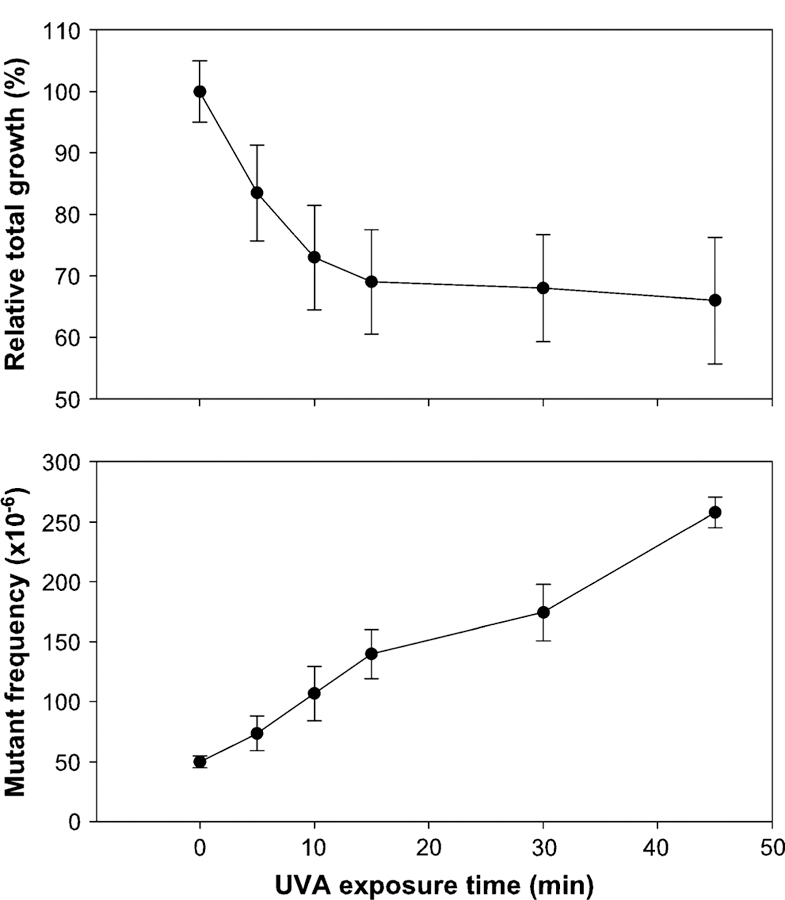
FIG. 2.

Cytotoxicity and mutagenicity of UVA in mouse lymphoma cells. The cells received 82.8 mJ/cm2/min UVA irradiation for different periods of time. Cytotoxicity (defined as relative total growth) is shown in the top panel, and Tk mutant frequency is displayed in the bottom panel. The data points represent the mean ± 1 standard deviation from three independent experiments.
