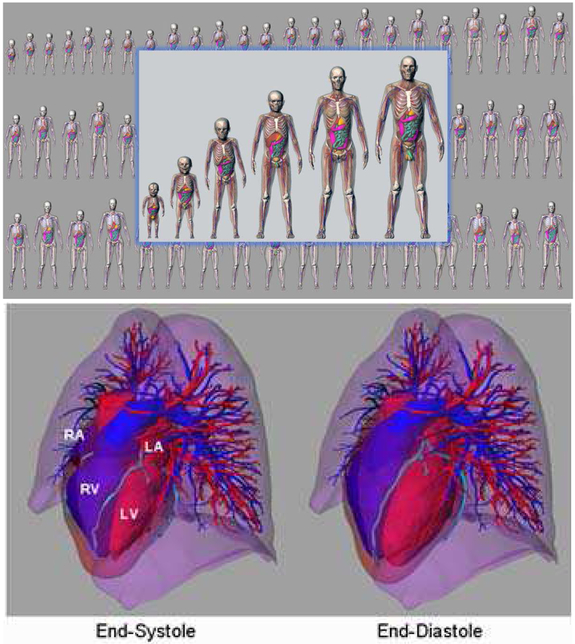
Fig. 1.
(Top) XCAT series of computational phantoms. (Bottom) Cardiac model of the XCAT phantom. Motion was based upon the analysis of tagged MRI data. Cardiac CT data was used to add details such as the coronary vessels. The right atria (RA), left atria (LA), right ventricle (RV) and left ventricle (LV) are labeled in the figure.

