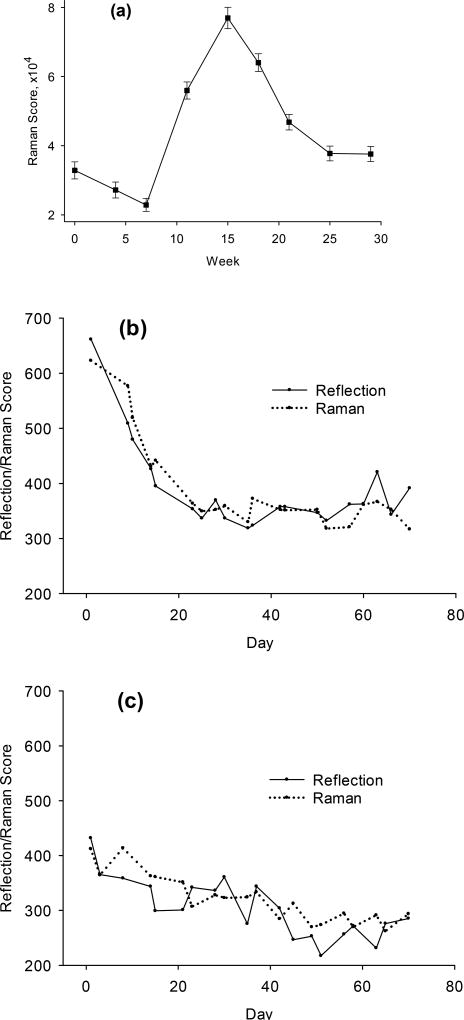
Fig. 12.
(a) Average RRS skin carotenoid scores and serum plasma concentrations measured over time in a controlled feeding intervention study (adapted from [10]). (b) and (c) Examples of RS and RRS skin carotenoid scores in depletion phase of study (day 0 corresponds to week 5 of study). RS scores are shown on solid line, RRS scores on dotted line. Tissue site for RS: thumb; tissue site for RRS: palm; b) example for subject with relatively high skin carotenoid score at the start of the depletion phase; c) subject with lowest skin carotenoid score.

