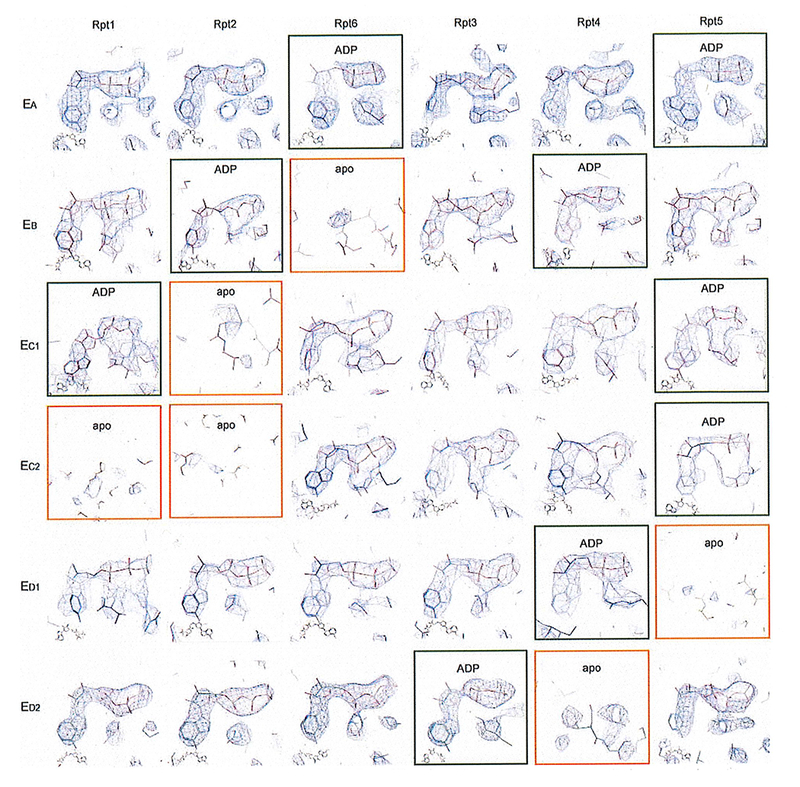
Extended Data Figure 6. The nucleotide densities in all states.

The nucleotide densities fitting with atomic models are shown with blue meshes. All close-up views were directly screen-copied from Coot58 after atomic modelling into the density maps without further modification or beautification. At the common contour level used for atomic modelling, the potential nucleotide densities in the apo-like subunits are mostly out, albeit they can show up partial nucleotide shapes at much lower contour level.
