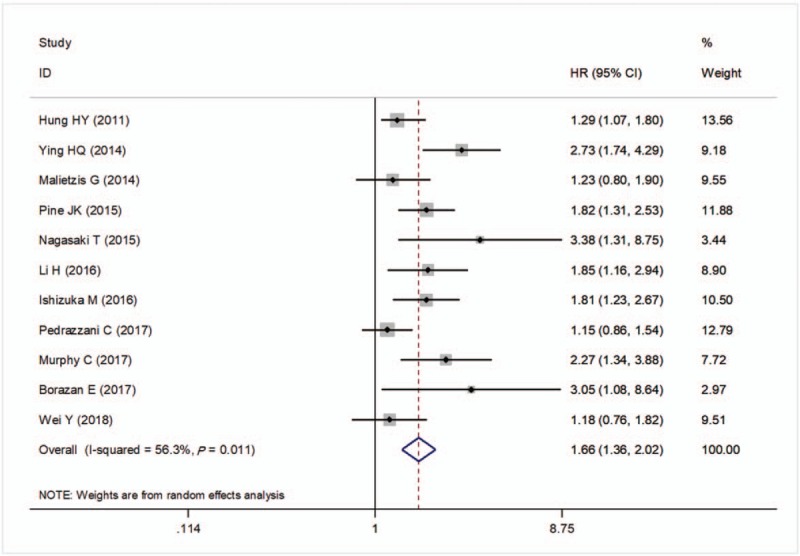
Figure 2.

Forest plots of the correlation of NLR with overall survival. Squares indicate HR; horizontal lines indicate 95% CI; diamond indicates the summary HR estimate with its 95% CI. CI = confidence intervals, HR = hazard ratio, NLR = neutrophil to lymphocyte ratio.
