Figure 4.

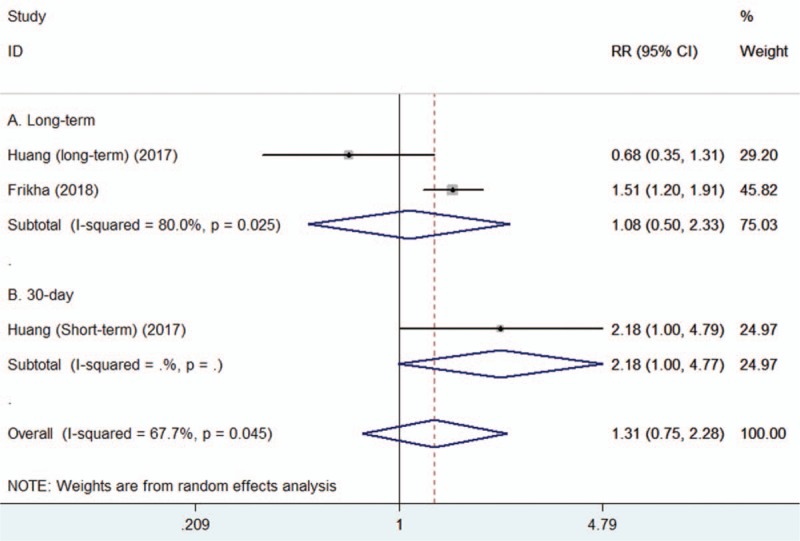
Forest plots showing risk ratio and 95% confidence interval of all-cause of mortality for the higher versus lower serum total bilirubin level.

Forest plots showing risk ratio and 95% confidence interval of all-cause of mortality for the higher versus lower serum total bilirubin level.