Figure 4.

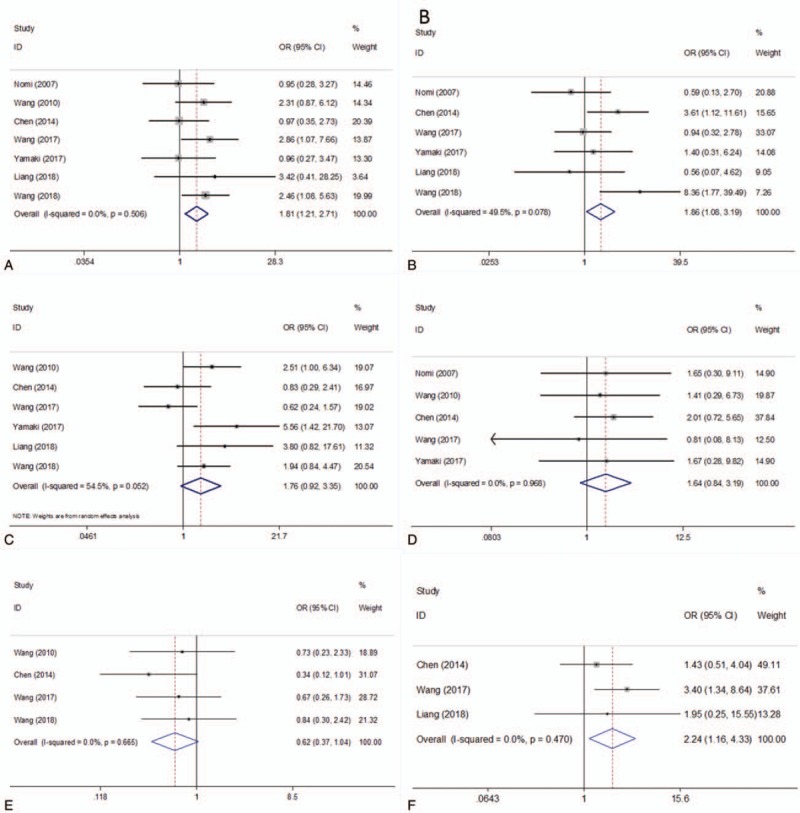
Forest plots for the association between PD-L1 expression and clinicopathological features. (A) N stage, (B) T stage, (C) gender, (D) M stage, (E) age, and (F) differentiation. PD-L1 = programmed cell death ligand 1.

Forest plots for the association between PD-L1 expression and clinicopathological features. (A) N stage, (B) T stage, (C) gender, (D) M stage, (E) age, and (F) differentiation. PD-L1 = programmed cell death ligand 1.