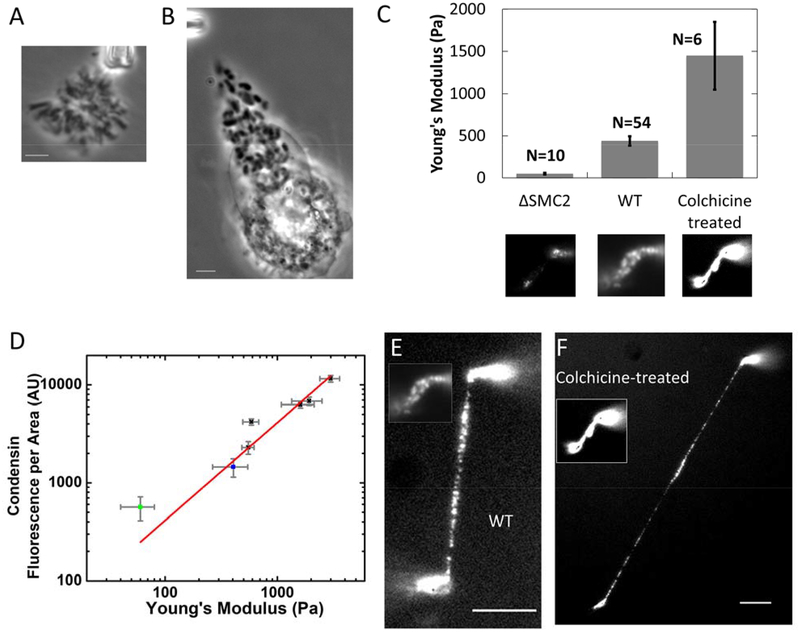
Figure 6. Metaphase-stalled cells have chromosomes which are stiffer and which have more condensin relative to WT.
(A-B) phase contrast image of whole genome isolated from untreated (A) and colchicine-treated (B) HeLa cells. (C) Young’s moduli of condensin depleted, native, and colchicine treated chromosomes. Lower panel images show representative examples of condensin immunostaining for each group. (D) Condensin fluorescence per chromosome occupied area versus Young’s modulus for condensin-depleted chromosomes (green squares), native chromosomes (blue squares), and colchicine-treated chromosomes (black squares). (E-F) Side-to-side comparison of native and colchicine- treated chromosome after stretching. Inserts show the chromosomes before stretching. Bar = 5μm. Note that the inset of panels E and F are the same image as the center and lower right insets of panel C, and also that the lower left inset of panel C is the same image shown in Fig. 4Cb.

