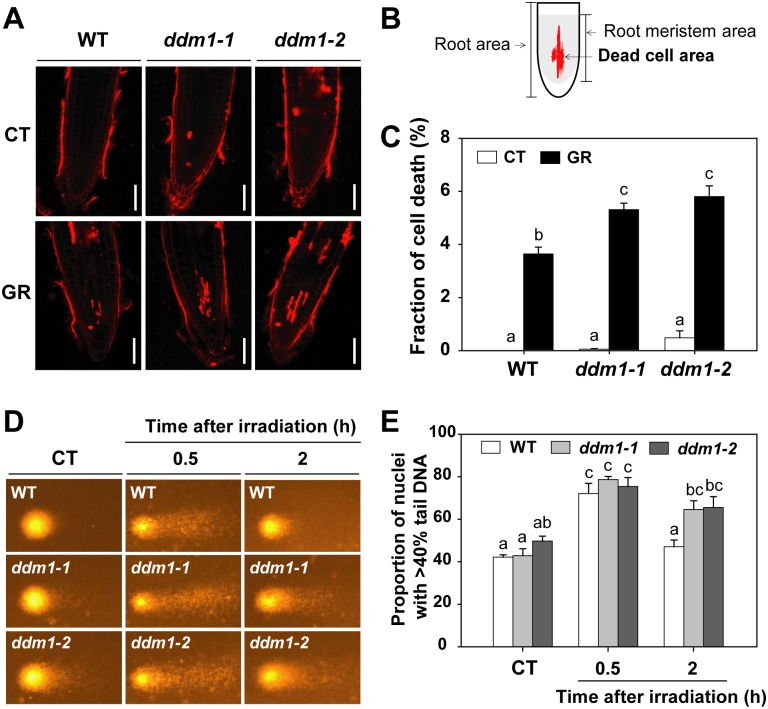
Fig 2. DDM1 mutation increases cellular DNA damage upon exposure to gamma radiation.
(A) Representative images of root tips, which were stained with propidium iodide 1 day after gamma irradiation. Scale bars: 50 μm. (B) Diagram to show extent of dead cell area. (C) Proportion of dead cell area in root meristem. Bars represent means ± SE (n = 19) from three independent experiments. (D) Representative comet images of nuclei and (E) proportion of nuclei with more than 40% tail DNA in WT and ddm1 mutants without or with exposure to 200 Gy of gamma radiation. Bars represent means ± SE (n = 3) of three independent experiments using 250 nuclei. Different letters in (C) and (E) indicate significant differences among the samples at a threshold of P < 0.05 [one-way ANOVA, Tukey’s honestly significant difference (HSD) test]. CT, control; GR, gamma radiation.

