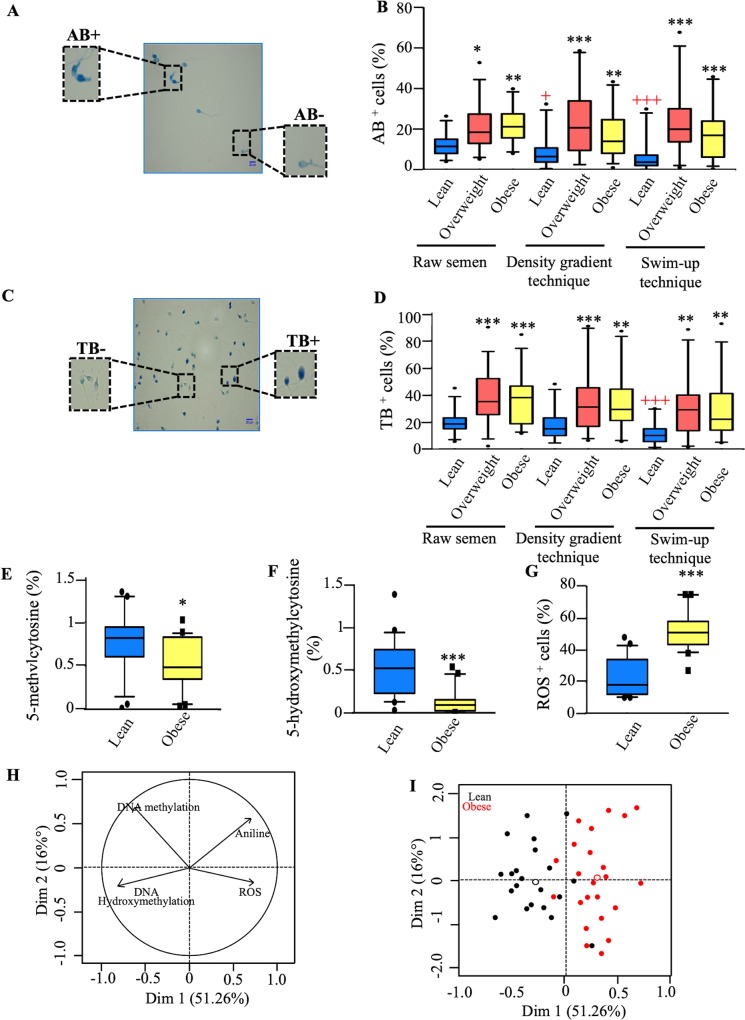
Fig 3. Alteration of sperm molecular parameters in obese men.
(A, B) Histones retention as assessed by aniline blue staining (AB) in the sperm of lean, overweight, and obese men. (A) Light blue sperm heads show normal histones retention (AB-) and abnormal dark blue sperm heads show abnormal histones retention (AB+). Scale bar = 20 μm. Magnification x100. (B) Boxplots presenting the percentage of AB+ cells in raw semen, and in motile sperm-enriched fractions post- density gradient and swim-up techniques of the lean, overweight, and obese groups. (C, D) Chromatin integrity as assessed by the toluidine blue staining (TB) in the sperm of lean, overweight, and obese men. (C) Light blue sperm heads show normal chromatin integrity (TB-) and abnormal dark purple sperm heads show abnormal chromatin integrity (TB+). Scale bar = 20 μm. Magnification x100. (D) Boxplots presenting the percentage of TB+ cells in raw semen and in motile sperm-enriched fractions post-density gradient and swim-up techniques of the lean, overweight, and obese groups. Boxplots presenting the global sperm content of 5-methylcytosine (E) and 5-hydroxymethylcytosine (F) DNA methylation. (G) ROS level as assessed by nitroblue tetrazolium test in the motile sperm of obese and lean men. Data expressed as median (min-max). Stars indicated groups that are statistically significantly different to control, (*p<0.05, **p<0.01, ***p<0.001). + indicated motile-enriched fractions which are statistically significantly different compared to the raw semen (+p<0.05, +++p<0.001). (H, I) Principal component analysis (PCA) plots. PCA analysis of the obesity and control groups based on molecular parameter values (DNA methylation, 5-hydroxymethulcytosine, AB+ cells percent and ROS levels). Variable factor maps (H). Individual factor map (I). Red and black points indicate obese and lean men, respectively.

