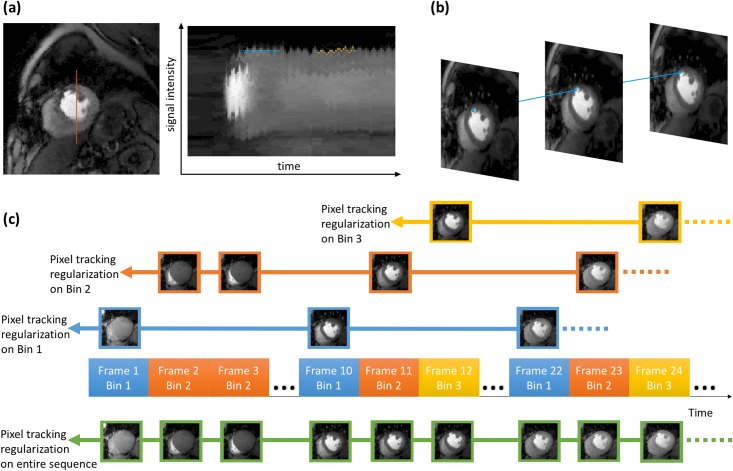
Fig 6. Illustration of pixel tracking temporal regularization.
(a) The right image shows the signal intensity line profile over time of the red line in the left image. Standard temporal total variation calculates total variation along the blue line, however pixel tracking temporal total variation calculates total variation along the yellow line. (b) The blue line shows estimated motion track of one pixel at the edge of blood pool. (c) Pixel tracking regularization is applied on both the entire image sequence (shown below the time axis), as well as each motion bin (shown above the time axis).

