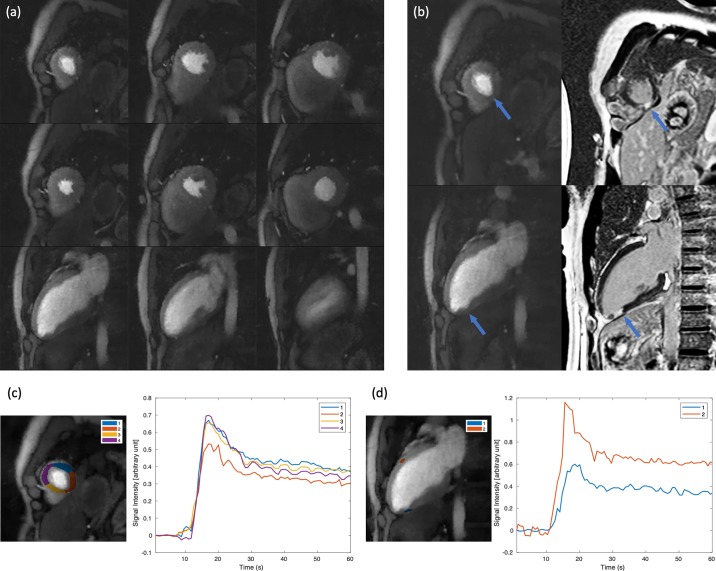
Fig 7. Results from an ECG-gated stress acquisition with a small perfusion deficit (subject 6).
6 SA slices and 3 2CH LA slices were acquired within each heartbeat. (a) shows all slices near peak myocardial enhancement. (b) shows a SA slice and a 2CH LA slice closely matching the corresponding LGE images are shown. A small area of deficit can be seen on both slices pointed by the arrows. This is more clearly seen in the time curves shown in (c), (d) for the corresponding ROI. Model-based registration [34] was performed before image segmentation. The time curves were normalized by proton density images and the pre-contrast baseline signal was subtracted.

