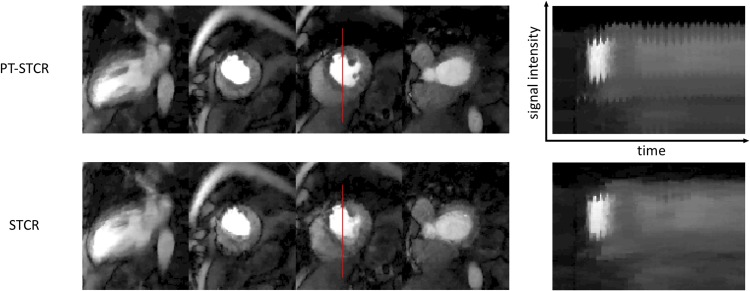
Fig 12. Comparison of PT-STCR and STCR in subject 4.
3 SA and 1 2CH LA slices were used in the SNR/CNR analysis are shown (9 slices were acquired). Vertical red lines on the images are used for comparison of signal intensity line profiles over time. PT-STCR reconstruction preserves the myocardial border better than STCR and has fewer artifacts. Images showing the signal intensity line profiles over time show that the PT-STCR reconstruction is sharper than the STCR reconstruction.

