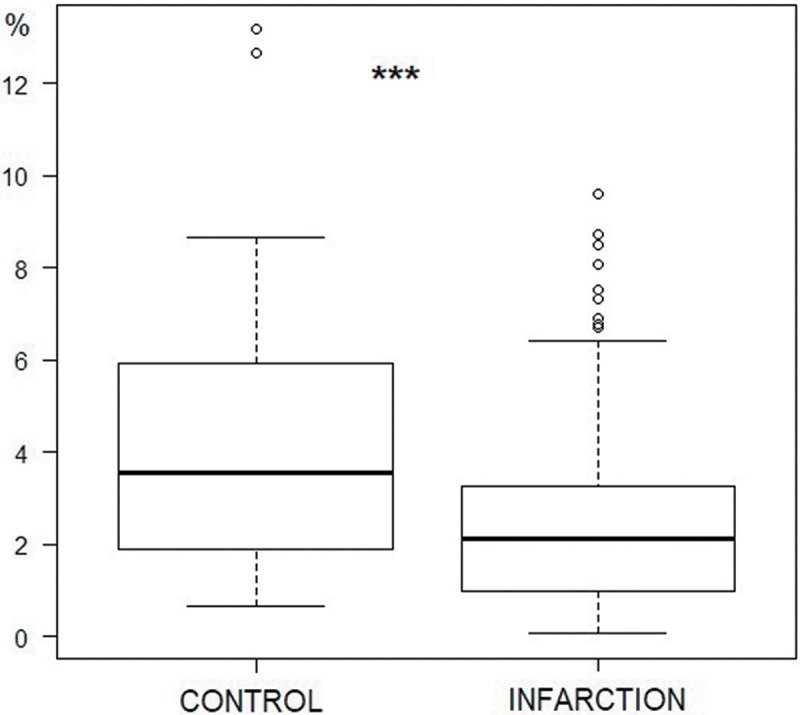
Fig 5. Density of Purkinje fibers in the control and infarction groups.

Density is expressed as a percentage of the total area of the tissue (***p<0.001, Fisher exact test).

Density is expressed as a percentage of the total area of the tissue (***p<0.001, Fisher exact test).