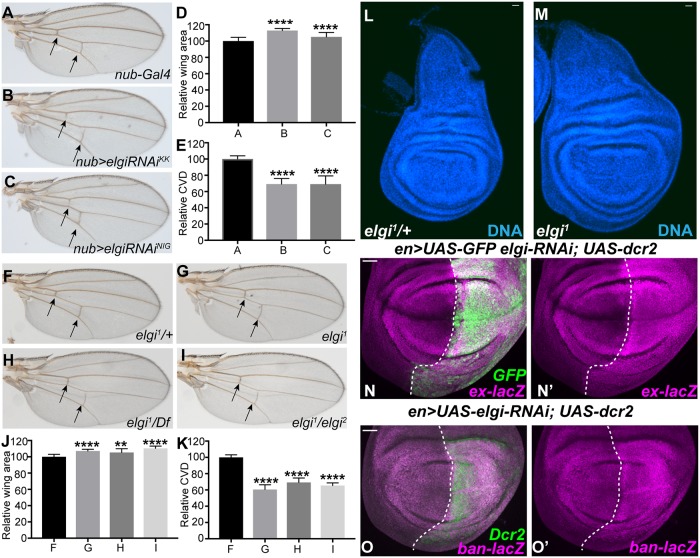
Fig 1. elgi mutant phenotypes.
(A-C) Adult male wings from flies expressing nub-Gal4 UAS-Dcr2 control (A), nub-Gal4 UAS-Dcr2 UAS-elgi-RNAiKK (VDRC109617) (B), and nub-Gal4 UAS-Dcr2 UAS-elgi-RNAiNIG (17033R-3) (C). Arrows point to the crossveins. (D) Histogram of relative wing areas in flies of the genotypes in panels A-C, as indicated (normalized to the average area of control wings); mean of B is 112.9, and C is 105.2. (E) Histogram of the ratio of crossvein distance (CVD) to wing length, (normalized to the average CVD/wing length in control wings) in flies of the genotypes in panels A-C, as indicated. (F-I) Adult male wings from elgi1/+ (control) (F), homozygous elgi1 (G), hemizygous elgi1/Df(3L) BSC575 (H), trans-heterozygous elgi1 / elgi2 (I) flies. Arrows point to the crossveins. (J) Histogram of relative wing areas (normalized to the average area of control wings) in flies of the genotypes in panels F-I, as indicated. Mean of G is 107.1; H is 105.4 and I is 110.4. (K) Histogram of the ratios of crossvein distance (CVD) to wing length, (normalized to the average CVD/wing length ratio of control wings) in flies of the genotypes in panels F-I, as indicated. Data are shown as mean ± SD from measurements of 10–13 wings per genotype. **P<0.002 and ****P<0.001, (Student’s t test between control and the other genotypes); (L,M) Wing imaginal discs from age matched control elgi1/+ and homozygous elgi1 4 day old third instar larvae. (N-O’) Third instar wing imaginal discs expressing en-Gal4 UAS-dcr2 UAS-GFP UAS-elgi-RNAi and ex-lacZ (N, N’) or ban-lacZ (O, O’) stained for expression of ex-lacZ or ban-lacZ (magenta), with posterior cells marked by expression of GFP or Dcr2. Dashed white line marks the A-P compartment boundary. Scale bar is 33 μm.

