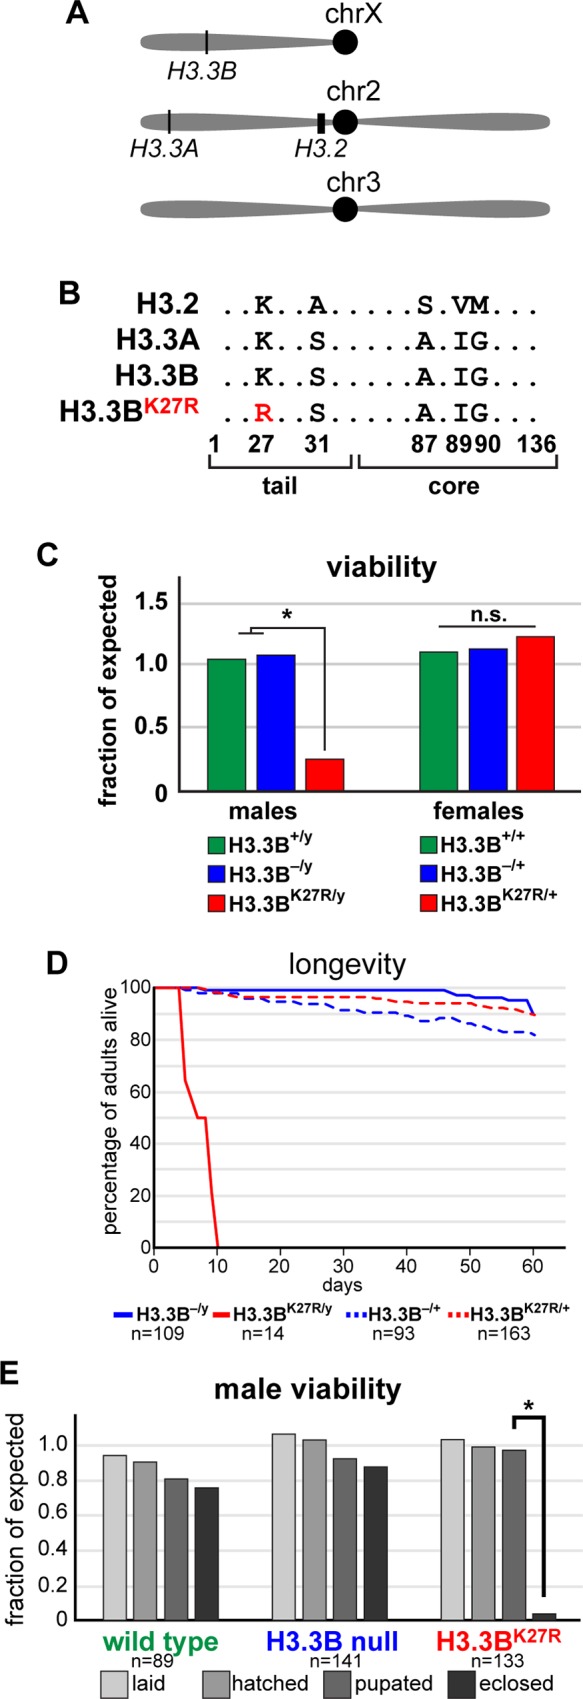
Fig 1. H3.3BK27R causes male lethality.

(A) Cartoon depicting the genomic locations of the three H3 loci. (B) Amino acid sequence of the three H3 proteins and the H3.3K27R mutant (highlighted in red). (C) Bar plot of the viability of wild type (green) males and females, as well as hemizygous males and heterozygous females for an H3.3B null allele (blue), and for the H3.3BK27R allele (red). Data are plotted as the fraction of expected based on the total number of flies. Asterisk indicates fewer than expected males survive (chi-square test, p value < 0.001). (D) Kaplan-Meyer plot of hemizygous males (solid lines) and heterozygous females (dashed lines) for H3.3B null (blue) and H3.3BK27R (red) alleles. n equals the number of adults assayed. (E) Bar plot of male viability at four developmental stages for the three indicated genotypes. Asterisk indicates fewer than expected males survive the pupal stage (chi-square test, p value < 0.001). n equals the starting number of eggs for each genotype.
