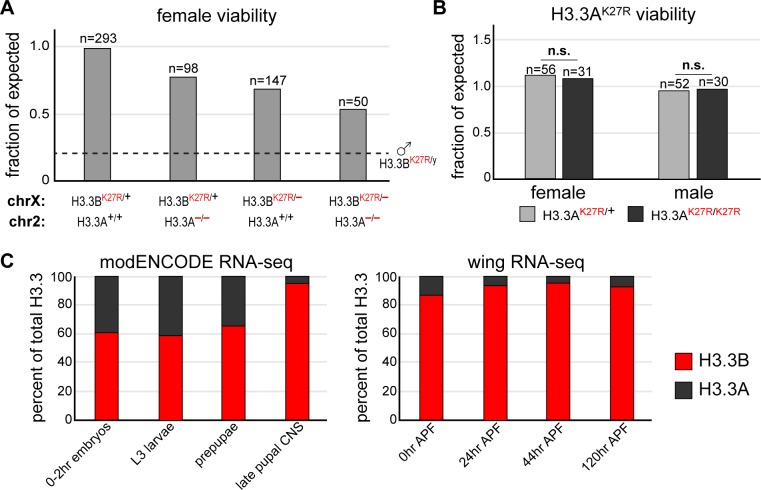
Fig 2. H3.3A and H3.3B are non-equivalent genes.
(A) Bar plot of female viability for the following genotypes: H3.3BK27R heterozygotes, H3.3BK27R heterozygotes also homozygous for an H3.3A null allele, trans-heterozygotes for H3.3BK27R and H3.3B null alleles, trans-heterozygotes for H3.3BK27R and H3.3B null alleles also homozygous null for H3.3A. The dashed line indicates H3.3BK27R male viability from Fig 1C. n equals the number of adults scored for each indicated genotype. (B) Bar plot of viability for males and females heterozygous (light gray) or homozygous (dark gray) for an H3.3AK27R allele. n equals the number of adults scored for each indicated genotype. (C) Stacked bar charts of H3.3B and H3.3A RNA-seq signal from selected modENCODE developmental stages and tissues (left) and four time points in wing development (right).

