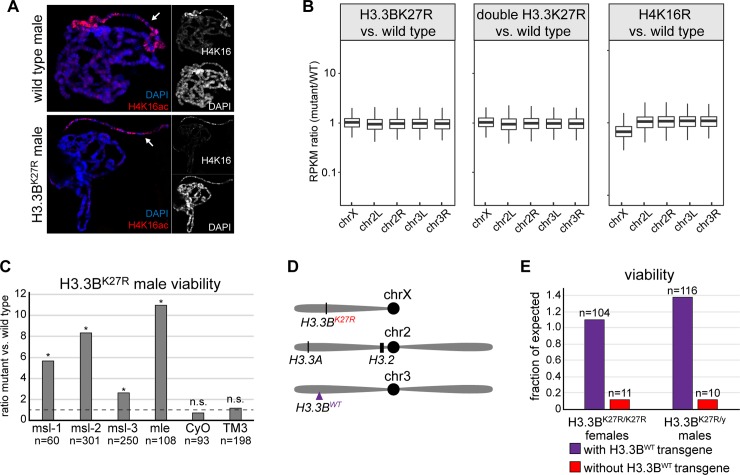
Fig 3. Levels of H3.3BK27R mutant histones determine the impact on development.
(A) Confocal images of salivary glands from wild type and H3.3BK27R male third instar larvae stained for H4K16ac and DAPI. Arrow indicates the X chromosome. (B) Box plots of RNA-seq values for genes located on the X chromosome and the four main autosomal arms. The ratio of RPKM values in mutant versus wild type is plotted for each gene. H4K16 mutant data are from [45]. (C) Bar plot of H3.3BK27R male viability for the six indicated genotypes. Data are plotted as the ratio of H3.3BK27R males inheriting the chromosome indicated under each bar relative to its homologous wild type chromosome. Asterisks indicate statistical significance by chi-square test (p values as follows: msl-1: 9.6x10⁻⁴, msl-2: 3.2x10⁻⁵, msl-3: 4.4x10⁻³, mle: 9.1x10⁻⁴, CyO: 0.37, TM3: 0.69). The dashed line indicates the expected ratio of 1. n equals the total number of males scored. (D) Cartoon of the genomic location of the H3.3BWT transgene relative to the endogenous H3 gene loci. (E) Bar plot of viability for homozygous H3.3BK27R females and hemizygous H3.3BK27R males inheriting the H3.3BWT transgenic chromosome (purple) or the non-transgenic homologous chromosome (red). n equals the number of adults scored for each indicated genotype.

