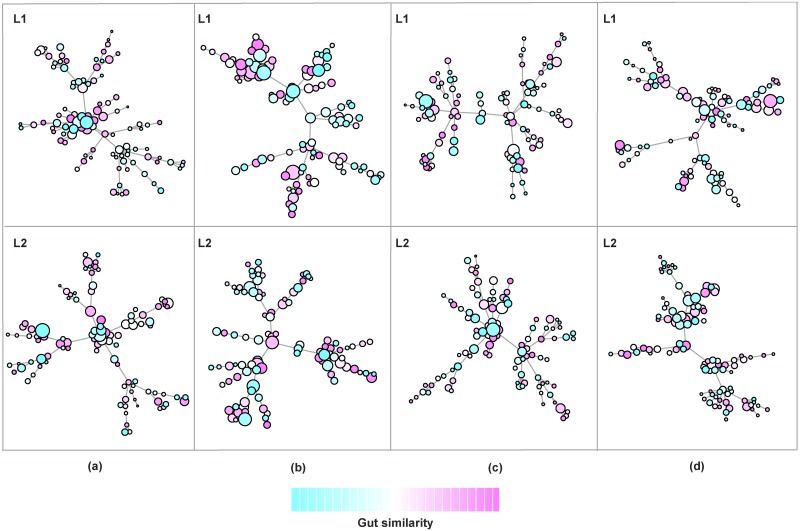
Fig 2. Structural and metabolic heterogeneity of nodes—Gut similarity and structural properties of nodes in the multiplex network.
We show the heterogeneity of nodes in terms of diets and gut similarity (θij) among nodes in the different layers of the multiplex network (L1 and L2), along with their structural measure of centrality and homophily [30]. The color, ranging from ‘light cyan’ to ‘violet’ passing through ‘white’, allows characterizing the distance among nodes in terms of gut similarity, so that the more similar are diets and gut bacterial composition, the closer will be the colors in the plot. The node size is log-proportional to the overall measure of centrality and homophily in the multiplex network [30]. For each column of the panel, we show the gut similarity before feedback (a), after the first feedback round (b), after the second feedback round(c), and after the third feedback round (d).

