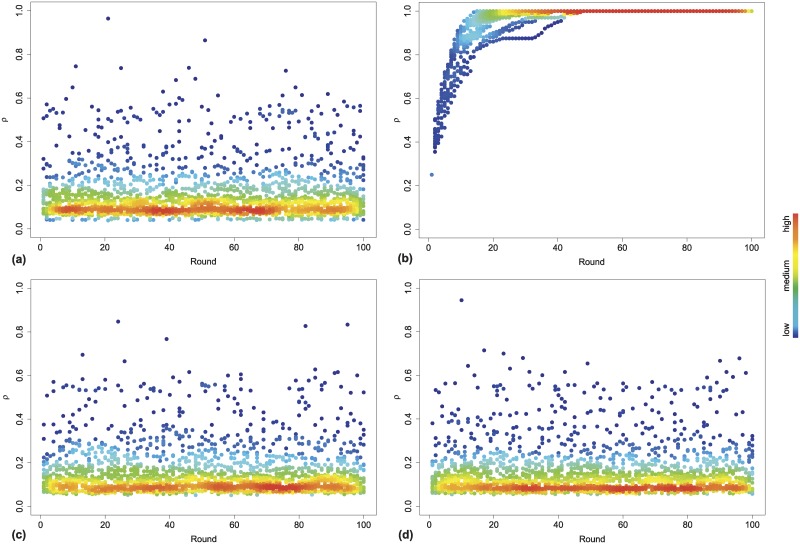
Fig 4. Evolutionary dynamics of the density of cooperative nodes over time.
We show the fraction of cooperative nodes ρi against the rounds or time steps (t) before feedback (a) and after the first feedback round (b), the second feedback round (c) and the third feedback round (d). ρ ranges in [0, 1], where 0 corresponds to the global defection, while 1 means a global cooperation of population. We simulated the evolutionary dynamics of the ISG for a fixed number of simulations, and the color, ranging from ‘blue’ to ‘red’, corresponds to the density ρi. We can observe a fluctuation in strategies determined by the feedback rounds from gut acting alternatively as incentives towards cooperativeness (see (b)) and a coexistence of the two strategies, with more defectors than cooperators (see (a), (c) and (d)).

