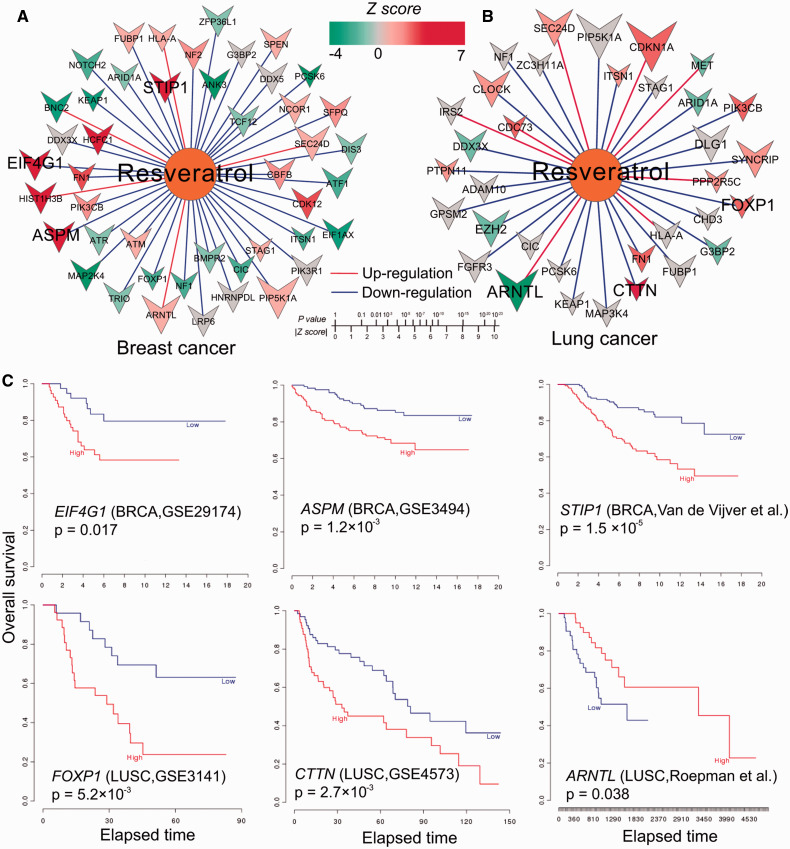
Figure 7:
Potential mechanism-of-action (MOA) for resveratrol’s predicted anticancer indications in breast and lung cancers. (A and B) The networks connecting resveratrol and significantly mutated genes in breast (A) and lung (B) cancer, respectively. In (A) and (B), the color of nodes represents the z-score of the association between gene expression and survival rate calculated by univariate Cox regression as described in a previous study.44 The size of gene nodes denotes the amplitude (a) value of differential expression by the treatment of resveratrol using the Connectivity Map data.40 The red edges denote up-regulation and blue edges denote down-regulation. (C) Kaplan-Meier survival curves show 6 overlapped genes (selected based on the most significant z-scores) between the significantly mutated genes in breast and lung cancer and the resveratrol down/up-regulated genes from the Connectivity Map. The curves were prepared by an online tool, PREdiction of Clinical Outcomes from Genomic profiles: https://precog.stanford.edu.

