Figure 3.

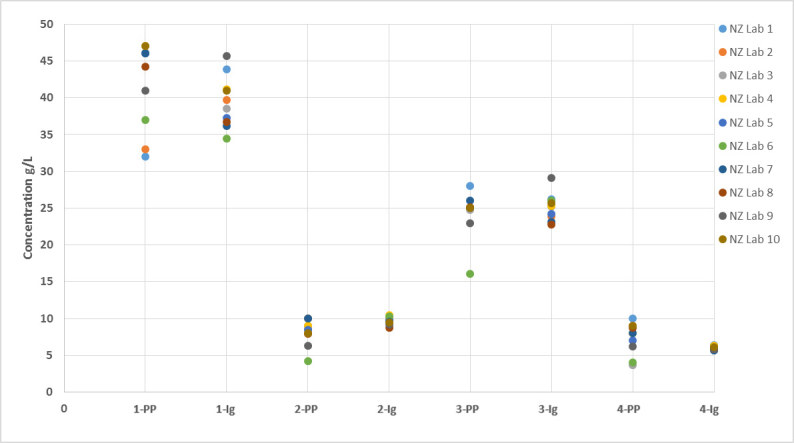
Comparison of paraprotein and total Ig concentrations between NZ laboratories. (The number denotes the sample number; PP – paraprotein concentration; Ig – total Ig concentration.)

Comparison of paraprotein and total Ig concentrations between NZ laboratories. (The number denotes the sample number; PP – paraprotein concentration; Ig – total Ig concentration.)