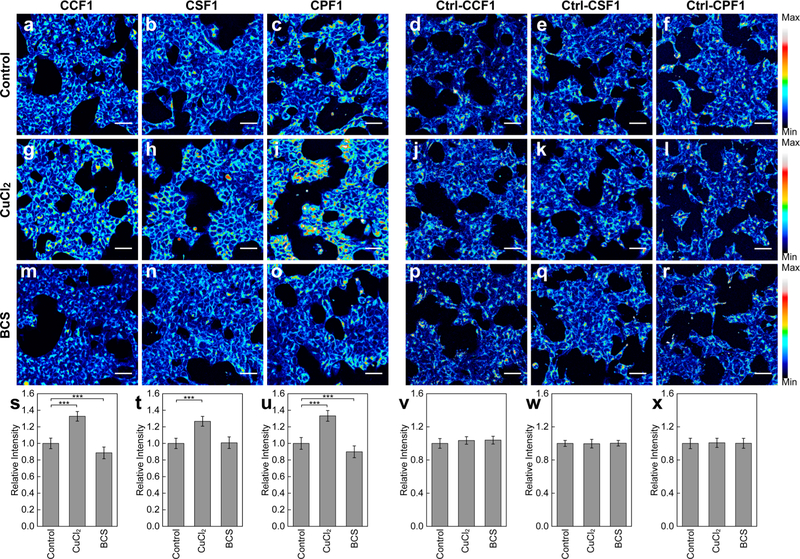
Figure 2.
Fluorescence imaging of labile copper pools in live HEK 293T cells with (a, g, m) CCF1, (b, h, n) CSF1, (c, i, o) CPF1, (d, j, p) Ctrl-CCF1, (e, k, q) Ctrl-CSF1, and (f, l, r) Ctrl-CPF1. Control cells (a–f) and cells incubated with (g–l) 100 μM CuCl2 or (m–r) 500 μM BCS in the growth medium for 12 h at 37 °C were stained with 5 μM dye for 30 min at 37 °C in DMEM. Scale bars: 40 μm. (s–x) Quantification of fluorescence intensity of cells stained with CCF1, CSF1, CPF1, Ctrl-CCF1, Ctrl-CSF1, and Ctrl-CPF1, respectively. Data were normalized to control cells and shown as average ± s.d. (CXF, n = 4; Ctrl-CXF, n = 3). ***P ≤ 0.001; two-tailed Student’s t test.

