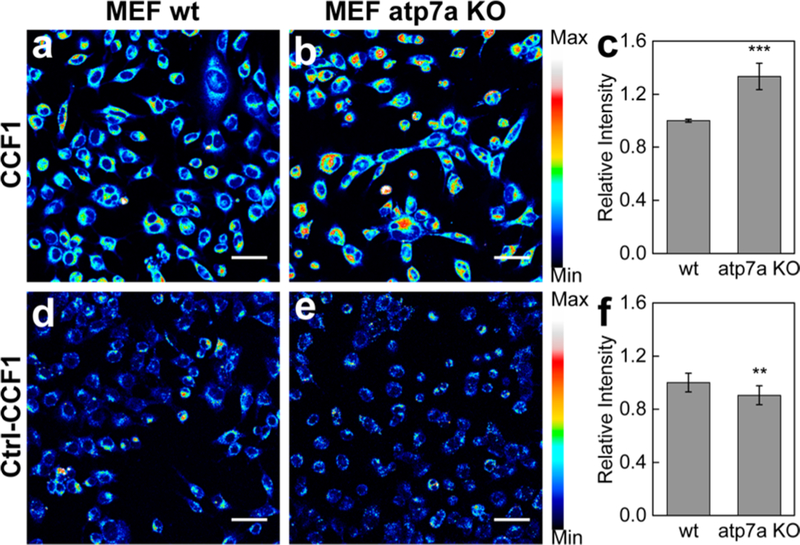
Figure 3.
Fluorescence imaging of labile copper pools in MEF wildtype (WT) and Atp 7a−/− knockout fibroblast cells with CCF1.(a) MEF WT cells and (b) MEF Atp7a−/− knockout cells were stained with 2 μM CCF1 for 10 min in DMEM, and their average fluorescence intensity was (c) quantified. (d) MEF WT cells and (e) MEF Atp7a−/− knockout cells were stained with 2 μM Ctrl-CCF1 for 10 min in DMEM and their average fluorescence intensity was (f) quantified. Scale bars: 40 μm. Data were normalized to MEF atp7a wt cells and shown as average ± s.d. (CCF1, n = 4; Ctrl-CCF1, n = 3). **P ≤ 0.01, ***P ≤ 0.001; two-tailed Student’s t test.

