
Figure 5. Screenshot of results.
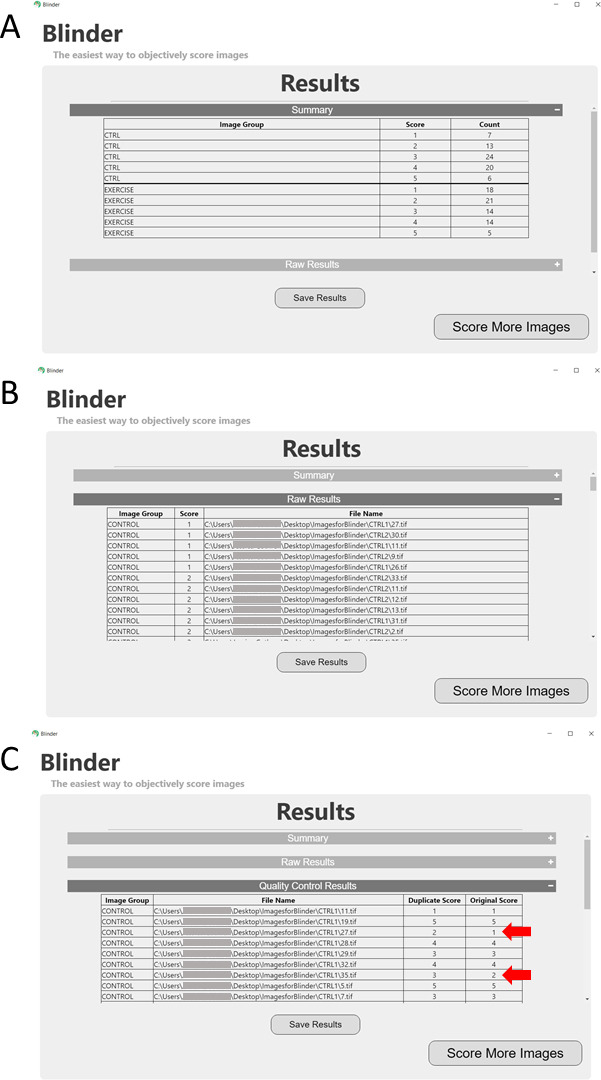
Panel A shows the summary indicating the number of images from each unblinded group (in this case, Control and Exercise) in each scoring category. Panel B gives the raw results indicating the score for each file (given as a full path). Panel C shows the results of the quality control, or repeated images. Red arrows highlight images with failed quality control (mismatched scores). See Notes section for tips if scoring fails quality control.