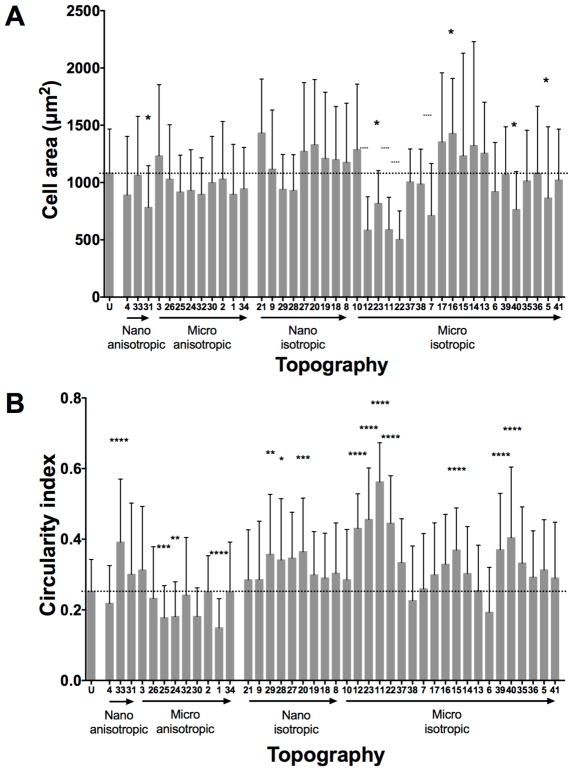
Figure 6.
Cell area and cell circularity quantification of HUVECs at 4 hour time point with initial 10000 cell/cm2 seeding density on non-coated patterned substrates. (A) Quantification of cell area and (B) cell circularity index of HUVECs on unpatterned and patterned surfaces. Geometry size, isotropy and anisotropy are indicated. Arrows represent increase in geometry size. Dotted line represents unpatterned surface mean value. Data (n=240 for unpatterned surfaces and n=60 for patterned surfaces) were evaluated on outliers using Grubb’s test. Statistical analysis was performed using one-way ANOVA test with Tukey’s post-hoc test. Data represent mean±SD, *P≤0.05, **P≤0.01, ***P≤0.001, ****P≤0.0001.

