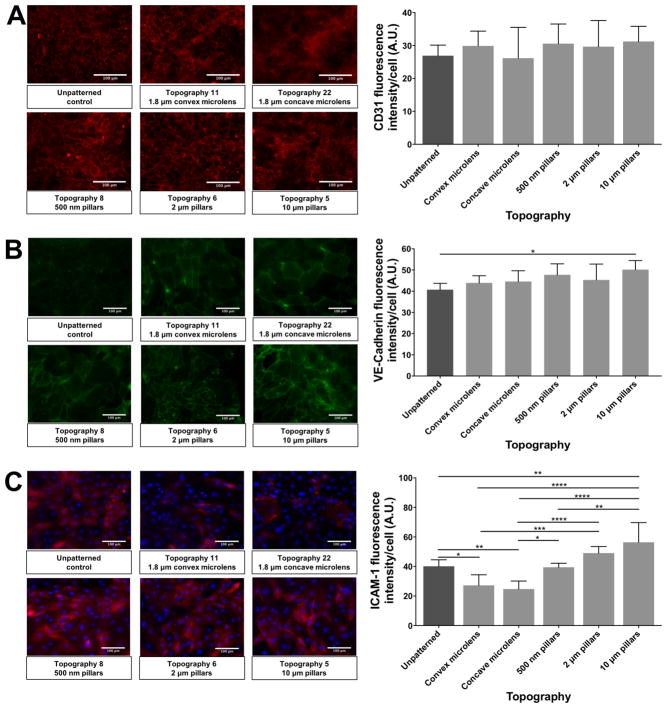
Figure 8.
Comparison of representative immunofluorescence images and quantified values of cell markers expression of HUVEC monolayer on selected patterned substrates. (A) CD31 expression (Red) of HUVEC monolayer on selected patterned substrates. (B) VE-cadherin expression (Green) of HUVEC monolayer on selected patterned substrates. (C) ICAM-1 expression (Red) of HUVEC monolayer on selected patterned substrates. Due to the uneven expression of ICAM-1 on the HUVEC monolayers, DAPI stained nuclei (Blue) was showed with ICAM-1 to help confirm the monolayer. In all panels, white bar represents 100 μm. Data (n=15 for all surfaces) were evaluated on outliers using Grubb’s test. Statistical analysis was performed using one-way ANOVA test with Tukey’s post-hoc test. Data represent mean±SD, *P≤0.05, **P≤0.01, ***P≤0.001, ****P≤0.0001.

