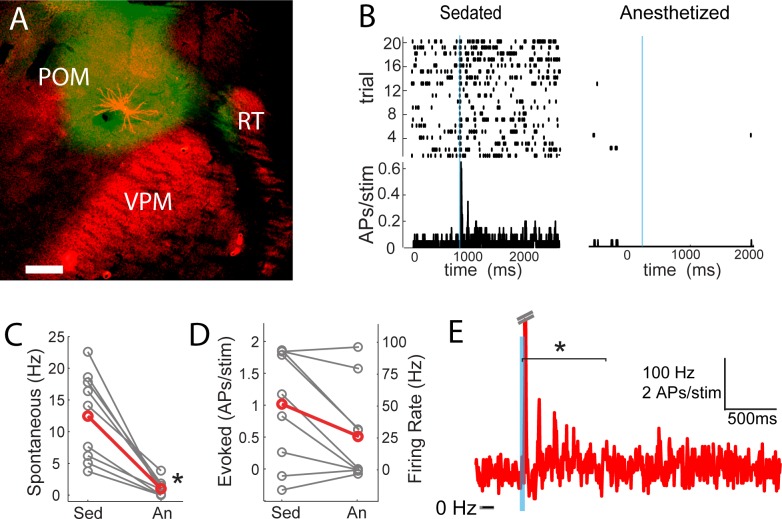
Figure 7. POm spiking mirrors L2/3 depolarization dynamics during anesthesia and sedation.
(A) Morphologically recovered POm neuron recorded and filled juxtasomally in vivo. Red, biocytin-Alexa594. Green, ChR2-YFP. (B) Raster plot (top) and PSTH (bottom) of a POm neuron’s response to photo-stimulation of ChR2-containing cortically-projecting axons. Left, POm cell recorded under sedation; Right, same cell under isoflurane-induced anesthesia. Blue line, 10 ms laser stimulation. (C) POm spontaneous activity is significantly lower under anesthesia than under sedation (paired t-test, n = 9, p=8×10⁻⁴). Gray, individual cells; Red, mean. (D) Photo-activation of POm cortically-projecting fibers elicits more antidromic spikes in POm under sedation than anesthesia (paired t-test, n = 9, p=0.091). Peak firing rate is baseline-corrected by subtracting spontaneous firing rate measured in the pre-laser period. Gray, individual cells; Red, mean. (E) Population PSTH of POm neurons that displayed persistent activation under sedation (n = 5). Each cell displays significant higher firing rate than baseline (t-test, p<0.01) during the persistent period (0–800 ms post light stimulation, indicated by the bracket). Dashes, peak truncation for clarity.

