. 2019 Jan 29;8:e38949. doi: 10.7554/eLife.38949

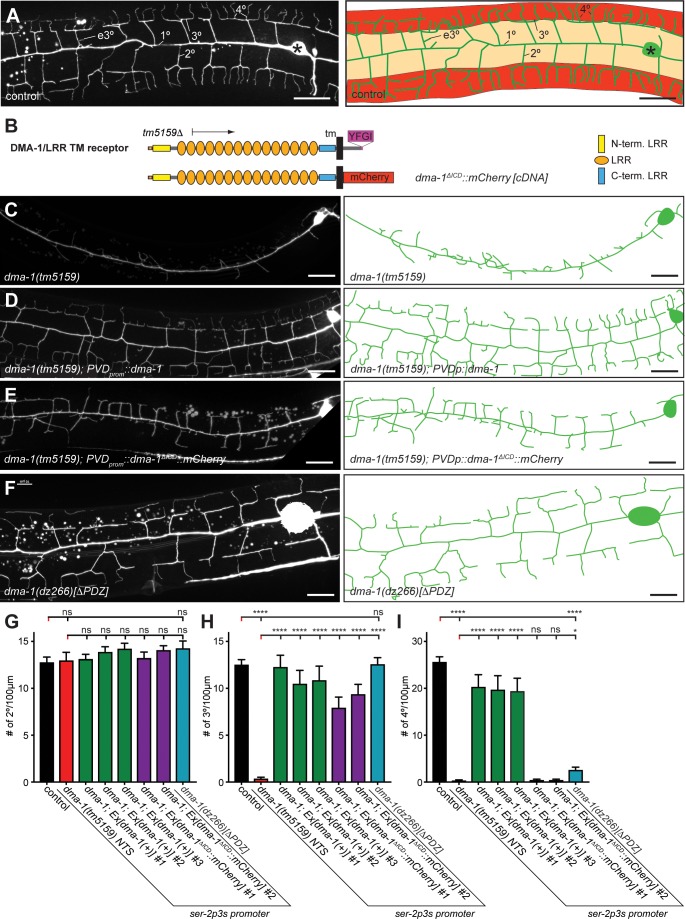
Figure 1. The intracellular domain of DMA-1/LRR-TM is required for higher order branching of PVD somatosensory dendrites.

(A) Fluorescent images of PVD (left panels) and schematics (right panels) of wild-type control animals. PVD is visualized by the wdIs52 [F49H12.4p::GFP] transgene in all panels. 1°, 2°, 3°, 4°, and ectopic 3° (e3°) dendrites are indicated. Anterior is to the left and dorsal is up in all panels, scale bars indicate 20 µm. (B) Schematics of the DMA-1/LRR-TM protein and a variant used in transgenic rescue experiments (dma-1(ΔICD)). A PDZ-binding site (YFGI) at the extreme C-terminus of DMA-1/LRR-TM is indicated in lilac. The predicted deletion from the tm5159 deletion allele is shown. (C-F) Fluorescent images of PVD (left panels) and schematics (right panels) of the genotypes indicated. Scale bar indicates 20 µm. (G) Quantification of 2°, 3°, and 4° branch numbers per 100 µm anterior to the PVD cell body. Data for three and two independent transgenic lines for the dma-1 wild type cDNA or the dma-1(ΔICD), respectively, are shown next to the data for the dma-1(dz266[∆PDZ]) allele. The data for dma-1(tm5159) NTS are nontransgenic siblings of a representative transgenic line. For raw data see Figure 1—source data 1. Data are represented as mean ± SEM. Statistical comparisons were performed using one-sided ANOVA with Sidak’s correction. Statistical significance is indicated (ns, not significant; ****, p < 0.0001). n = 20 animals per genotype.

Figure 1—source data 1. Complete source data.
DOI: 10.7554/eLife.38949.003

Figure 1.

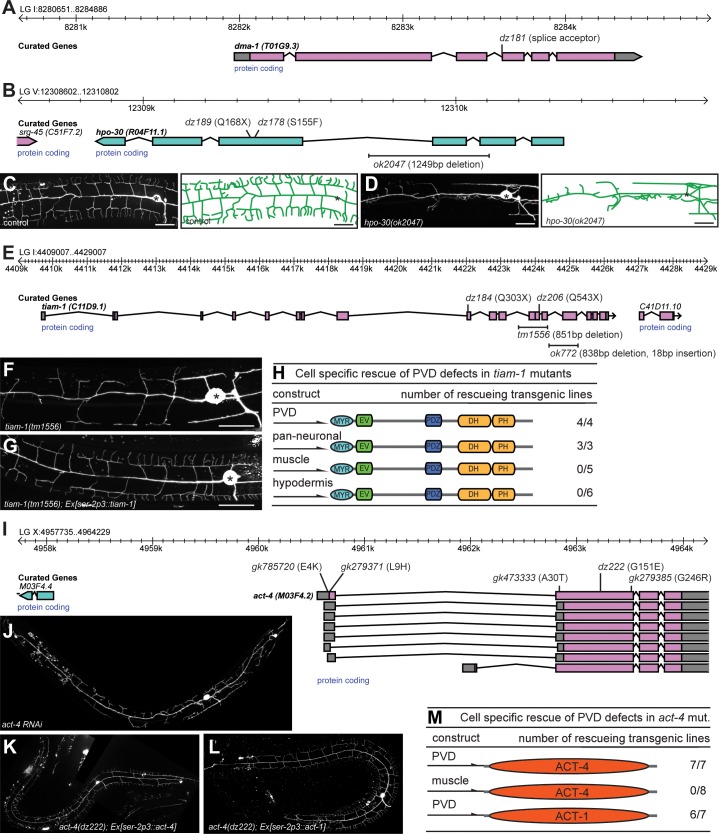
Figure 1—figure supplement 1. Genes functioning cell-autonomously in PVD somatosensory neurons.

Figure 1—figure supplement 1.

(A–B). Genomic environs of the indicated genes with the physical location on the respective linkage groups (LGs) are shown. The exon-intron structure is indicated, as is the direction of transcription. Alleles and the resulting molecular changes are shown above (for point mutants) and below (for deletions) the gene structure, respectively. dz178 introduces a S155F mutation in the third predicted transmembrane domain in HPO-30/Claudin (B). (C) – (D) Fluorescent images of PVD (left panels) and schematics (right panels) of wild type control (C) and hpo-30(ok2047) mutant animals (D). PVD is visualized by the wdIs52 [F49H12.4p::GFP] transgene and, anterior is to the left and dorsal is up in all panels; scale bars indicate 20 µm. (E) Genomic environs of tiam-1 with the physical location on linkage group I are shown. The exon-intron structure is indicated as well as the direction of transcription. Alleles and the resulting molecular changes are shown above (for point mutants) and below (for deletions) the gene structure, respectively. (F – G) Fluorescent images of PVD of tiam-1(tm1556) animals without (F) and with a transgene expressing a wild type TIAM-1 cDNA under control of the PVD-specific ser-2p3 promoter (Tsalik et al., 2003) (G). (H) Summary of transgenic rescue experiments of tiam-1(tm1556) mutant animals. Cell-specific promoters are shown on the left (PVD: ser-2p3 (Tsalik et al., 2003); pan-neuronal: rab-3p (Nonet et al., 1997); myo-3p muscle: (Okkema et al., 1993); and dpy-7p hypodermis (Gilleard et al., 1997)). The number of rescuing transgenic lines out of the total number of independent transgenic lines obtained is shown on the right. (I) Genomic environs of act-4 with the physical location on linkage group X are shown. The exon-intron structure is indicated as well as the direction of transcription. Alleles and the resulting molecular changes are shown above the gene structure. (J– L) Fluorescent images of PVD in wild-type animals after RNAi-mediated gene knock down of act-4 and, of act-4(dz222) mutant animals carrying a transgene expressing a wild type ACT-4 (K) or ACT-1 (L) genomic DNA, respectively, under control of the PVD specific ser-2p3 promoter (Tsalik et al., 2003). (M) Summary of transgenic rescue experiments of act-4(dz222) mutant animals with ACT-4 or ACT-1, respectively. Cell-specific promoters are shown on the left (PVD: ser-2p3 (Tsalik et al., 2003); myo-3p muscle: (Okkema et al., 1993)). The number of rescuing transgenic lines out of the total number of independent transgenic lines obtained is shown on the right.